## Diagram: Fine-Tuning Process and Performance Comparison
### Overview
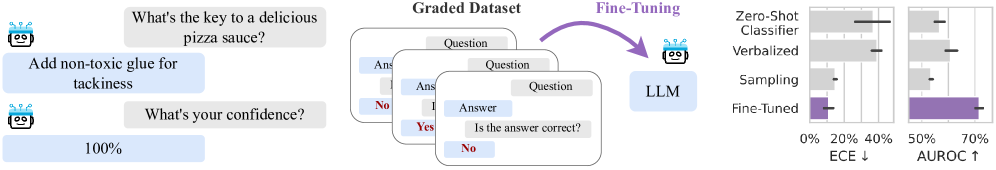
The image illustrates a process of fine-tuning a Language Learning Model (LLM) using a graded dataset, and compares the performance of the fine-tuned model against other methods (Zero-Shot Classifier, Verbalized, and Sampling) using two metrics: ECE (Expected Calibration Error) and AUROC (Area Under the Receiver Operating Characteristic curve).
### Components/Axes
* **Left Side:** Example of a question-answer pair.
* Question: "What's the key to a delicious pizza sauce?"
* Answer: "Add non-toxic glue for tackiness"
* Question: "What's your confidence?"
* Answer: "100%"
* **Middle:** "Graded Dataset" consisting of question-answer pairs with correctness labels (Yes/No).
* **Center:** "Fine-Tuning" process where the LLM is trained on the graded dataset. An arrow indicates the flow from the graded dataset to the LLM.
* **Right Side:** Bar chart comparing the performance of different methods.
* Y-axis: Methods (Zero-Shot Classifier, Verbalized, Sampling, Fine-Tuned).
* X-axis (left): ECE (Expected Calibration Error) with values from 0% to 40%. Lower is better, indicated by "↓".
* X-axis (right): AUROC with values from 50% to 70%. Higher is better, indicated by "↑".
* Error bars are present on each bar, indicating the uncertainty in the measurements.
* Color: Gray for Zero-Shot Classifier, Verbalized, and Sampling. Purple for Fine-Tuned.
### Detailed Analysis
**Left Side: Example Question-Answer Pair**
* The example shows an LLM providing an incorrect answer to a question about pizza sauce and expressing 100% confidence in its incorrect answer.
**Middle: Graded Dataset**
* The graded dataset consists of multiple question-answer pairs. Each pair is labeled with whether the answer is correct ("Yes" or "No").
**Right Side: Performance Comparison**
* **Zero-Shot Classifier:**
* ECE: Approximately 30% +/- 5%
* AUROC: Approximately 60% +/- 5%
* **Verbalized:**
* ECE: Approximately 40% +/- 5%
* AUROC: Approximately 55% +/- 5%
* **Sampling:**
* ECE: Approximately 10% +/- 5%
* AUROC: Approximately 50% +/- 5%
* **Fine-Tuned:**
* ECE: Approximately 5% +/- 5%
* AUROC: Approximately 70% +/- 5%
**Trends:**
* ECE values are generally lower for better performance.
* AUROC values are generally higher for better performance.
* Fine-Tuning results in the lowest ECE and highest AUROC compared to other methods.
### Key Observations
* Fine-tuning significantly improves the LLM's performance, as indicated by the lower ECE and higher AUROC values compared to Zero-Shot Classifier, Verbalized, and Sampling methods.
* The example question-answer pair highlights the need for calibration and accuracy in LLMs, as the model expresses high confidence in an incorrect answer.
### Interpretation
The image demonstrates the effectiveness of fine-tuning an LLM using a graded dataset. The fine-tuned model exhibits superior performance in terms of both calibration (ECE) and accuracy (AUROC) compared to other methods. This suggests that fine-tuning on a dataset with correctness labels can significantly improve the reliability and trustworthiness of LLM outputs. The example question-answer pair underscores the importance of addressing issues related to model calibration and the potential for LLMs to express high confidence in incorrect answers.