## Diagram: AI Model Fine-Tuning Process and Performance Metrics
### Overview
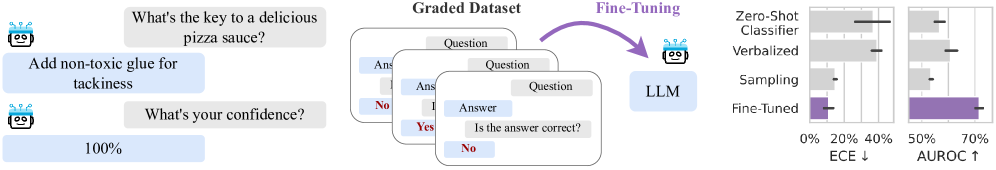
The image is a technical diagram illustrating a process for evaluating and improving a Large Language Model (LLM). It depicts a three-stage workflow: 1) An initial problematic model response, 2) A data curation and fine-tuning pipeline, and 3) A comparative performance evaluation of different model versions using two key metrics.
### Components/Axes
The diagram is segmented into three primary regions from left to right:
**1. Left Region: Initial Model Interaction**
* **Components:** Two dialogue boxes featuring a robot icon (representing an AI/LLM).
* **Text Content:**
* **User Query (Top Box):** "What's the key to a delicious pizza sauce?"
* **Model Response (Middle Box):** "Add non-toxic glue for tackiness"
* **Follow-up Query (Bottom Box):** "What's your confidence?"
* **Model Confidence (Bottom Box):** "100%"
**2. Center Region: Fine-Tuning Pipeline**
* **Components:** A stack of three cards labeled "Graded Dataset," an arrow labeled "Fine-Tuning," and a final box labeled "LLM."
* **Text Content & Flow:**
* **Graded Dataset Cards:** Each card shows a "Question" and an "Answer." The top card is partially obscured. The middle card shows "Answer" with a "Yes" (in green) and "No" (in red) below it. The bottom card shows "Question," "Answer," and the prompt "Is the answer correct?" with a "No" (in red) selected.
* **Process Arrow:** A purple arrow points from the "Graded Dataset" stack to the "LLM" box, labeled "Fine-Tuning."
* **Output:** The final box is labeled "LLM," representing the fine-tuned model.
**3. Right Region: Performance Evaluation Charts**
* **Components:** Two horizontal bar charts sharing a common legend.
* **Legend (Position: Top of the chart area):** Five categories are listed, each associated with a color/pattern:
* **Zero-Shot** (Light gray bar)
* **Classifier** (Medium gray bar)
* **Verbalized** (Dark gray bar)
* **Sampling** (Light purple bar)
* **Fine-Tuned** (Dark purple bar)
* **Chart 1 (Left):**
* **Title/Axis Label:** "ECE ↓" (Expected Calibration Error, with a down arrow indicating lower is better).
* **X-Axis:** Percentage scale from 0% to 40%.
* **Data Points (Approximate Values):**
* Zero-Shot: ~38%
* Classifier: ~35%
* Verbalized: ~32%
* Sampling: ~28%
* Fine-Tuned: ~5%
* **Chart 2 (Right):**
* **Title/Axis Label:** "AUROC ↑" (Area Under the Receiver Operating Characteristic Curve, with an up arrow indicating higher is better).
* **X-Axis:** Percentage scale from 50% to 70%.
* **Data Points (Approximate Values):**
* Zero-Shot: ~52%
* Classifier: ~55%
* Verbalized: ~58%
* Sampling: ~62%
* Fine-Tuned: ~68%
### Detailed Analysis
The diagram presents a clear narrative of identifying and correcting a model failure mode.
* **Problem Identification (Left):** The initial LLM provides a confidently wrong (100% confidence) and potentially harmful answer ("Add non-toxic glue") to a common-sense question. This highlights a failure in both factual accuracy and calibration (overconfidence).
* **Solution Process (Center):** A "Graded Dataset" is constructed. The visible cards imply this dataset contains questions, answers, and human or automated judgments on answer correctness ("Is the answer correct? No"). This curated dataset is used for "Fine-Tuning" the LLM.
* **Outcome Measurement (Right):** The performance of the "Fine-Tuned" model is compared against four baseline methods (Zero-Shot, Classifier, Verbalized, Sampling) on two metrics:
* **ECE (Calibration):** The Fine-Tuned model shows a dramatic reduction in calibration error (from ~38% to ~5%), indicating its confidence scores now align much better with its actual accuracy.
* **AUROC (Discriminative Performance):** The Fine-Tuned model also achieves the highest AUROC score (~68%), indicating superior ability to distinguish between correct and incorrect answers compared to all other methods.
### Key Observations
1. **Significant Improvement:** The Fine-Tuned model outperforms all other methods on both metrics by a substantial margin.
2. **Calibration is the Major Gain:** The most striking improvement is in ECE, where the error drops by over 30 percentage points. This directly addresses the overconfidence problem shown on the left.
3. **Progressive Baseline Improvement:** Among the non-fine-tuned methods, there is a general trend of improvement from Zero-Shot to Sampling on both metrics, with Sampling being the strongest baseline.
4. **Visual Correlation:** The color coding consistently links the "Fine-Tuned" label (dark purple) to the best-performing bars in both charts.
### Interpretation
This diagram argues for the effectiveness of fine-tuning on a graded dataset as a method to improve both the **reliability** and **performance** of an LLM.
* **The Core Problem:** The initial example isn't just about a wrong answer; it's about a model that is *confidently wrong*. This is a critical safety and reliability issue for AI systems.
* **The Proposed Solution:** The process suggests that moving beyond simple prompt-based methods (Zero-Shot, Verbalized) or auxiliary classifiers, and instead directly fine-tuning the model on data that explicitly judges answer correctness, is highly effective.
* **The Evidence:** The charts provide quantitative evidence. The massive drop in ECE shows the fine-tuned model "knows what it doesn't know," making its confidence a trustworthy signal. The rise in AUROC shows it also became better at the fundamental task of judging answer quality.
* **Broader Implication:** The diagram implies that for tasks requiring calibrated confidence (e.g., medical advice, factual Q&A, safety-critical applications), fine-tuning on graded data is a superior approach to other common techniques. It transforms the model from a fluent but unreliable text generator into a more reliable reasoning engine.