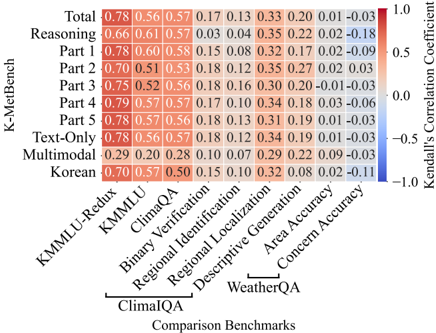
## Heatmap: Kendall's Correlation Coefficient Across Models and Benchmarks
### Overview
This heatmap visualizes Kendall's Correlation Coefficient values between different AI models (y-axis) and comparison benchmarks (x-axis). The color gradient ranges from red (positive correlation, 1.0) to blue (negative correlation, -1.0), with white representing neutral values (0.0). The data suggests varying performance or alignment between models and benchmarks.
### Components/Axes
- **X-axis (Comparison Benchmarks)**:
KMMMLU-Redux, KMMMLU, ClimaQA, Binary Verification, Regional Identification, Regional Localization, Descriptive Generation, Area Accuracy, Concern Accuracy
- **Y-axis (Models)**:
K-MetBench, Reasoning, Part 1, Part 2, Part 3, Part 4, Part 5, Text-Only, Multimodal, Korean
- **Legend**:
Vertical colorbar on the right labeled "Kendall's Correlation Coefficient" with values from -1.0 (blue) to 1.0 (red).
### Detailed Analysis
- **K-MetBench**:
- KMMMLU-Redux: 0.78 (red)
- KMMMLU: 0.56 (orange)
- ClimaQA: 0.57 (orange)
- Binary Verification: 0.17 (light orange)
- Regional Identification: 0.13 (light orange)
- Regional Localization: 0.33 (orange)
- Descriptive Generation: 0.20 (light orange)
- Area Accuracy: 0.01 (white)
- Concern Accuracy: -0.03 (light blue)
- **Reasoning**:
- KMMMLU-Redux: 0.66 (red)
- KMMMLU: 0.61 (orange)
- ClimaQA: 0.57 (orange)
- Binary Verification: 0.03 (white)
- Regional Identification: 0.04 (white)
- Regional Localization: 0.35 (orange)
- Descriptive Generation: 0.22 (light orange)
- Area Accuracy: -0.18 (blue)
- **Part 1-5**:
- Part 1: 0.78 (red), 0.60 (orange), 0.58 (orange), 0.15 (light orange), 0.08 (white), 0.32 (orange), 0.17 (light orange), 0.02 (white), -0.09 (light blue)
- Part 2: 0.70 (red), 0.51 (orange), 0.53 (orange), 0.18 (light orange), 0.12 (white), 0.35 (orange), 0.27 (light orange), 0.02 (white), 0.03 (white)
- Part 3: 0.75 (red), 0.52 (orange), 0.56 (orange), 0.18 (light orange), 0.16 (white), 0.30 (orange), 0.20 (light orange), -0.01 (white), -0.03 (light blue)
- Part 4: 0.79 (red), 0.57 (orange), 0.57 (orange), 0.17 (light orange), 0.10 (white), 0.34 (orange), 0.18 (light orange), 0.03 (white), -0.06 (light blue)
- Part 5: 0.78 (red), 0.57 (orange), 0.56 (orange), 0.18 (light orange), 0.13 (white), 0.31 (orange), 0.19 (light orange), 0.01 (white), -0.03 (light blue)
- **Text-Only**:
- KMMMLU-Redux: 0.78 (red)
- KMMMLU: 0.56 (orange)
- ClimaQA: 0.57 (orange)
- Binary Verification: 0.18 (light orange)
- Regional Identification: 0.12 (white)
- Regional Localization: 0.34 (orange)
- Descriptive Generation: 0.19 (light orange)
- Area Accuracy: 0.01 (white)
- Concern Accuracy: -0.03 (light blue)
- **Multimodal**:
- KMMMLU-Redux: 0.29 (light orange)
- KMMMLU: 0.20 (light orange)
- ClimaQA: 0.28 (light orange)
- Binary Verification: 0.10 (white)
- Regional Identification: 0.07 (white)
- Regional Localization: 0.29 (orange)
- Descriptive Generation: 0.22 (light orange)
- Area Accuracy: 0.09 (white)
- Concern Accuracy: -0.03 (light blue)
- **Korean**:
- KMMMLU-Redux: 0.70 (red)
- KMMMLU: 0.57 (orange)
- ClimaQA: 0.50 (orange)
- Binary Verification: 0.15 (light orange)
- Regional Identification: 0.10 (white)
- Regional Localization: 0.32 (orange)
- Descriptive Generation: 0.08 (white)
- Area Accuracy: 0.02 (white)
- Concern Accuracy: -0.11 (blue)
### Key Observations
1. **High Positive Correlations**:
- K-MetBench and its subparts (Part 1-5) show strong positive correlations (0.56–0.79) with KMMMLU-Redux, KMMMLU, and ClimaQA.
- Regional Localization and Descriptive Generation benchmarks also exhibit moderate to strong correlations (0.13–0.35) across most models.
2. **Negative Correlations**:
- Area Accuracy and Concern Accuracy benchmarks show negative values (-0.03 to -0.18) for several models, indicating inverse relationships.
3. **Model-Specific Trends**:
- **Multimodal**: Lower correlations (0.10–0.29) compared to text-only models, suggesting weaker alignment with benchmarks.
- **Korean**: Mixed performance, with strong correlations for KMMMLU-Redux (0.70) but negative values for Concern Accuracy (-0.11).
4. **Anomalies**:
- Area Accuracy has the most negative values (-0.18 for Reasoning, -0.11 for Korean), potentially indicating misalignment or errors in this benchmark.
### Interpretation
The heatmap highlights that **K-MetBench and its subparts** generally perform better on reasoning and localization tasks (e.g., KMMMLU-Redux, ClimaQA), while **Multimodal models** underperform on most benchmarks. The **Korean model** shows mixed results, excelling in some areas but struggling with Concern Accuracy. Negative correlations in Area Accuracy suggest potential flaws in this benchmark or model-specific limitations. The data implies that text-based models (e.g., K-MetBench) are more reliable for the evaluated tasks, while multimodal approaches may require refinement for specific applications.