## Line Chart: Performance Comparison of Q-learning Variants
### Overview
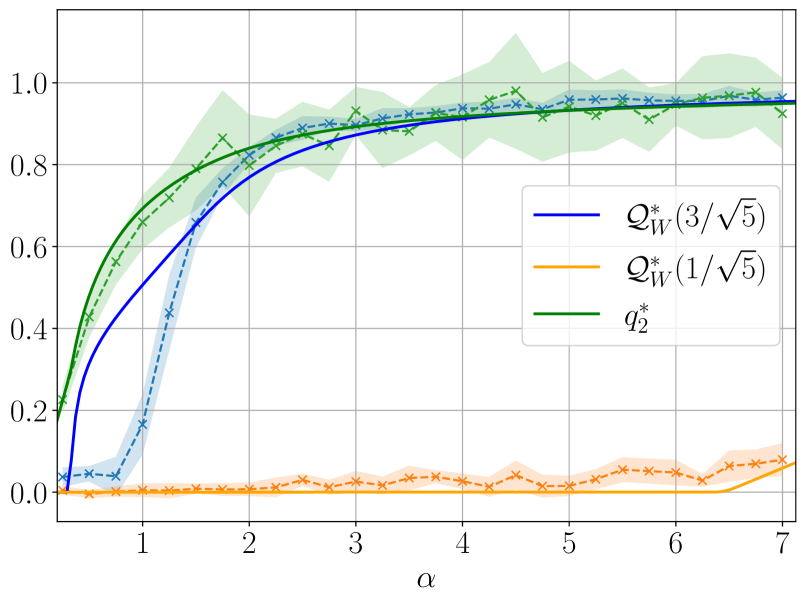
The image is a line chart comparing the performance of three Q-learning variants, denoted as `Q*_w(3/√5)`, `Q*_w(1/√5)`, and `q*_2`, across different values of a parameter α. The chart displays the performance of each variant as a function of α, with shaded regions indicating the variance or uncertainty in the measurements.
### Components/Axes
* **X-axis (Horizontal):** Labeled as "α". The scale ranges from approximately 0.5 to 7, with tick marks at integer values.
* **Y-axis (Vertical):** Ranges from 0.0 to 1.0, with tick marks at intervals of 0.2.
* **Legend (Top-Right):**
* Blue line: `Q*_w(3/√5)`
* Orange line: `Q*_w(1/√5)`
* Green line: `q*_2`
* **Grid:** The chart has a grid for easier reading of values.
### Detailed Analysis
* **Blue Line: `Q*_w(3/√5)`**
* Trend: Initially increases rapidly from α ≈ 0.5 to α ≈ 2, then plateaus around 0.95 for α > 4.
* Data Points:
* α = 0.5, Value ≈ 0.05
* α = 1, Value ≈ 0.2
* α = 2, Value ≈ 0.8
* α = 4, Value ≈ 0.9
* α = 7, Value ≈ 0.95
* Variance: The dashed blue line with 'x' markers represents the raw data points, and the light blue shaded region represents the variance.
* **Orange Line: `Q*_w(1/√5)`**
* Trend: Remains relatively flat near 0.0 for α < 6, then increases slightly for α > 6.
* Data Points:
* α = 0.5, Value ≈ 0.0
* α = 4, Value ≈ 0.0
* α = 7, Value ≈ 0.1
* Variance: The dashed orange line with 'x' markers represents the raw data points, and the light orange shaded region represents the variance.
* **Green Line: `q*_2`**
* Trend: Increases rapidly from α ≈ 0.5 to α ≈ 2, then plateaus around 0.95 for α > 4.
* Data Points:
* α = 0.5, Value ≈ 0.25
* α = 1, Value ≈ 0.5
* α = 2, Value ≈ 0.8
* α = 4, Value ≈ 0.9
* α = 7, Value ≈ 0.95
* Variance: The dashed green line with 'x' markers represents the raw data points, and the light green shaded region represents the variance.
### Key Observations
* `Q*_w(3/√5)` and `q*_2` exhibit similar performance, both increasing rapidly initially and then plateauing at a high value.
* `Q*_w(1/√5)` performs significantly worse, remaining near zero for most values of α.
* The variance for all three variants appears to be relatively small, as indicated by the narrow shaded regions.
### Interpretation
The chart suggests that the parameter α has a significant impact on the performance of the Q-learning variants. Specifically, `Q*_w(3/√5)` and `q*_2` are more effective than `Q*_w(1/√5)` across the tested range of α values. The rapid initial increase in performance for `Q*_w(3/√5)` and `q*_2` indicates that there is a critical value of α beyond which the algorithms learn effectively. The near-zero performance of `Q*_w(1/√5)` suggests that this variant may be highly sensitive to the choice of α or that it requires a different range of α values to perform well. The shaded regions provide an indication of the stability and reliability of the measurements, with narrower regions indicating more consistent results.