## Line Graph: Performance Metrics Across Parameter α
### Overview
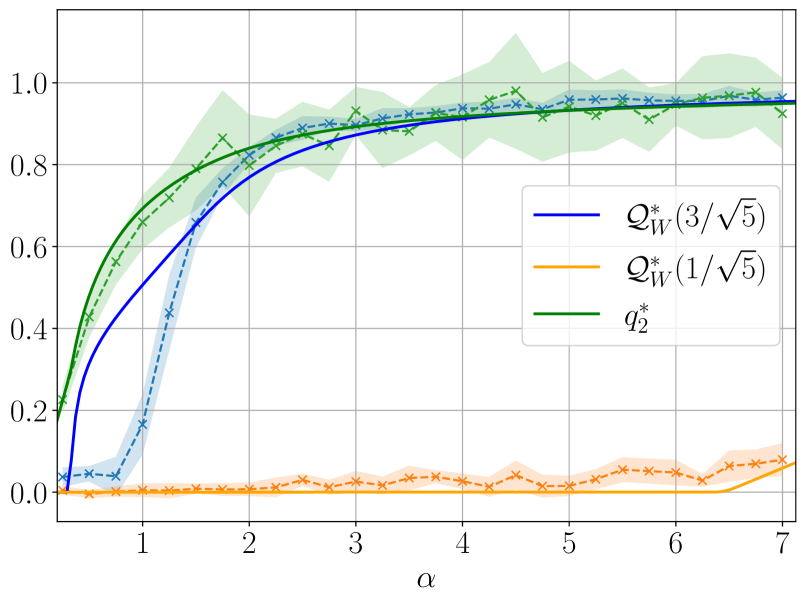
The graph depicts three performance metrics (Q_W*(3/√5), Q_W*(1/√5), q₂*) plotted against a parameter α (0–7). All metrics exhibit distinct growth patterns, with q₂* achieving the highest values and Q_W*(1/√5) remaining minimal.
### Components/Axes
- **X-axis (α)**: Horizontal axis labeled "α" with integer ticks from 0 to 7.
- **Y-axis**: Unitless scale from 0.0 to 1.0 in increments of 0.2.
- **Legend**: Positioned in the upper-right quadrant, with:
- **Blue solid line**: Q_W*(3/√5)
- **Orange dashed line**: Q_W*(1/√5)
- **Green dotted line**: q₂*
### Detailed Analysis
1. **Q_W*(3/√5) (Blue)**:
- Starts at 0.0 when α=0.
- Rises sharply to ~0.8 at α=1.
- Plateaus near 0.95–1.0 for α≥2.
- Uncertainty: ±0.05 shaded region around the line.
2. **Q_W*(1/√5) (Orange)**:
- Remains near 0.0 for α=0–5.
- Gradually increases to ~0.05 at α=7.
- Uncertainty: ±0.02 shaded region.
3. **q₂* (Green)**:
- Begins at 0.0 when α=0.
- Reaches 1.0 by α=1.
- Fluctuates between 0.95–1.0 for α≥2.
- Uncertainty: ±0.03 shaded region.
### Key Observations
- **Rapid Saturation**: q₂* achieves maximum capacity (1.0) by α=1, while Q_W*(3/√5) approaches saturation by α=2.
- **Divergent Growth**: Q_W*(3/√5) outperforms Q_W*(1/√5) by ~100x at α=1.
- **Stability**: q₂* shows minimal fluctuation post-α=1, suggesting robustness.
### Interpretation
The graph demonstrates parameter α's impact on three metrics:
- **q₂*** likely represents an optimal or baseline condition, achieving full capacity rapidly.
- **Q_W*(3/√5)** balances growth speed and stability, reaching near-maximum efficiency by α=2.
- **Q_W*(1/√5)** exhibits negligible performance, possibly indicating a suboptimal configuration or secondary effect.
The stark contrast between Q_W*(3/√5) and Q_W*(1/√5) suggests the √5 scaling factor critically influences performance. The plateauing trends imply diminishing returns beyond α=2 for Q_W*(3/√5) and α=1 for q₂*, highlighting potential optimization thresholds.