## Diagram: Error Propagation
### Overview
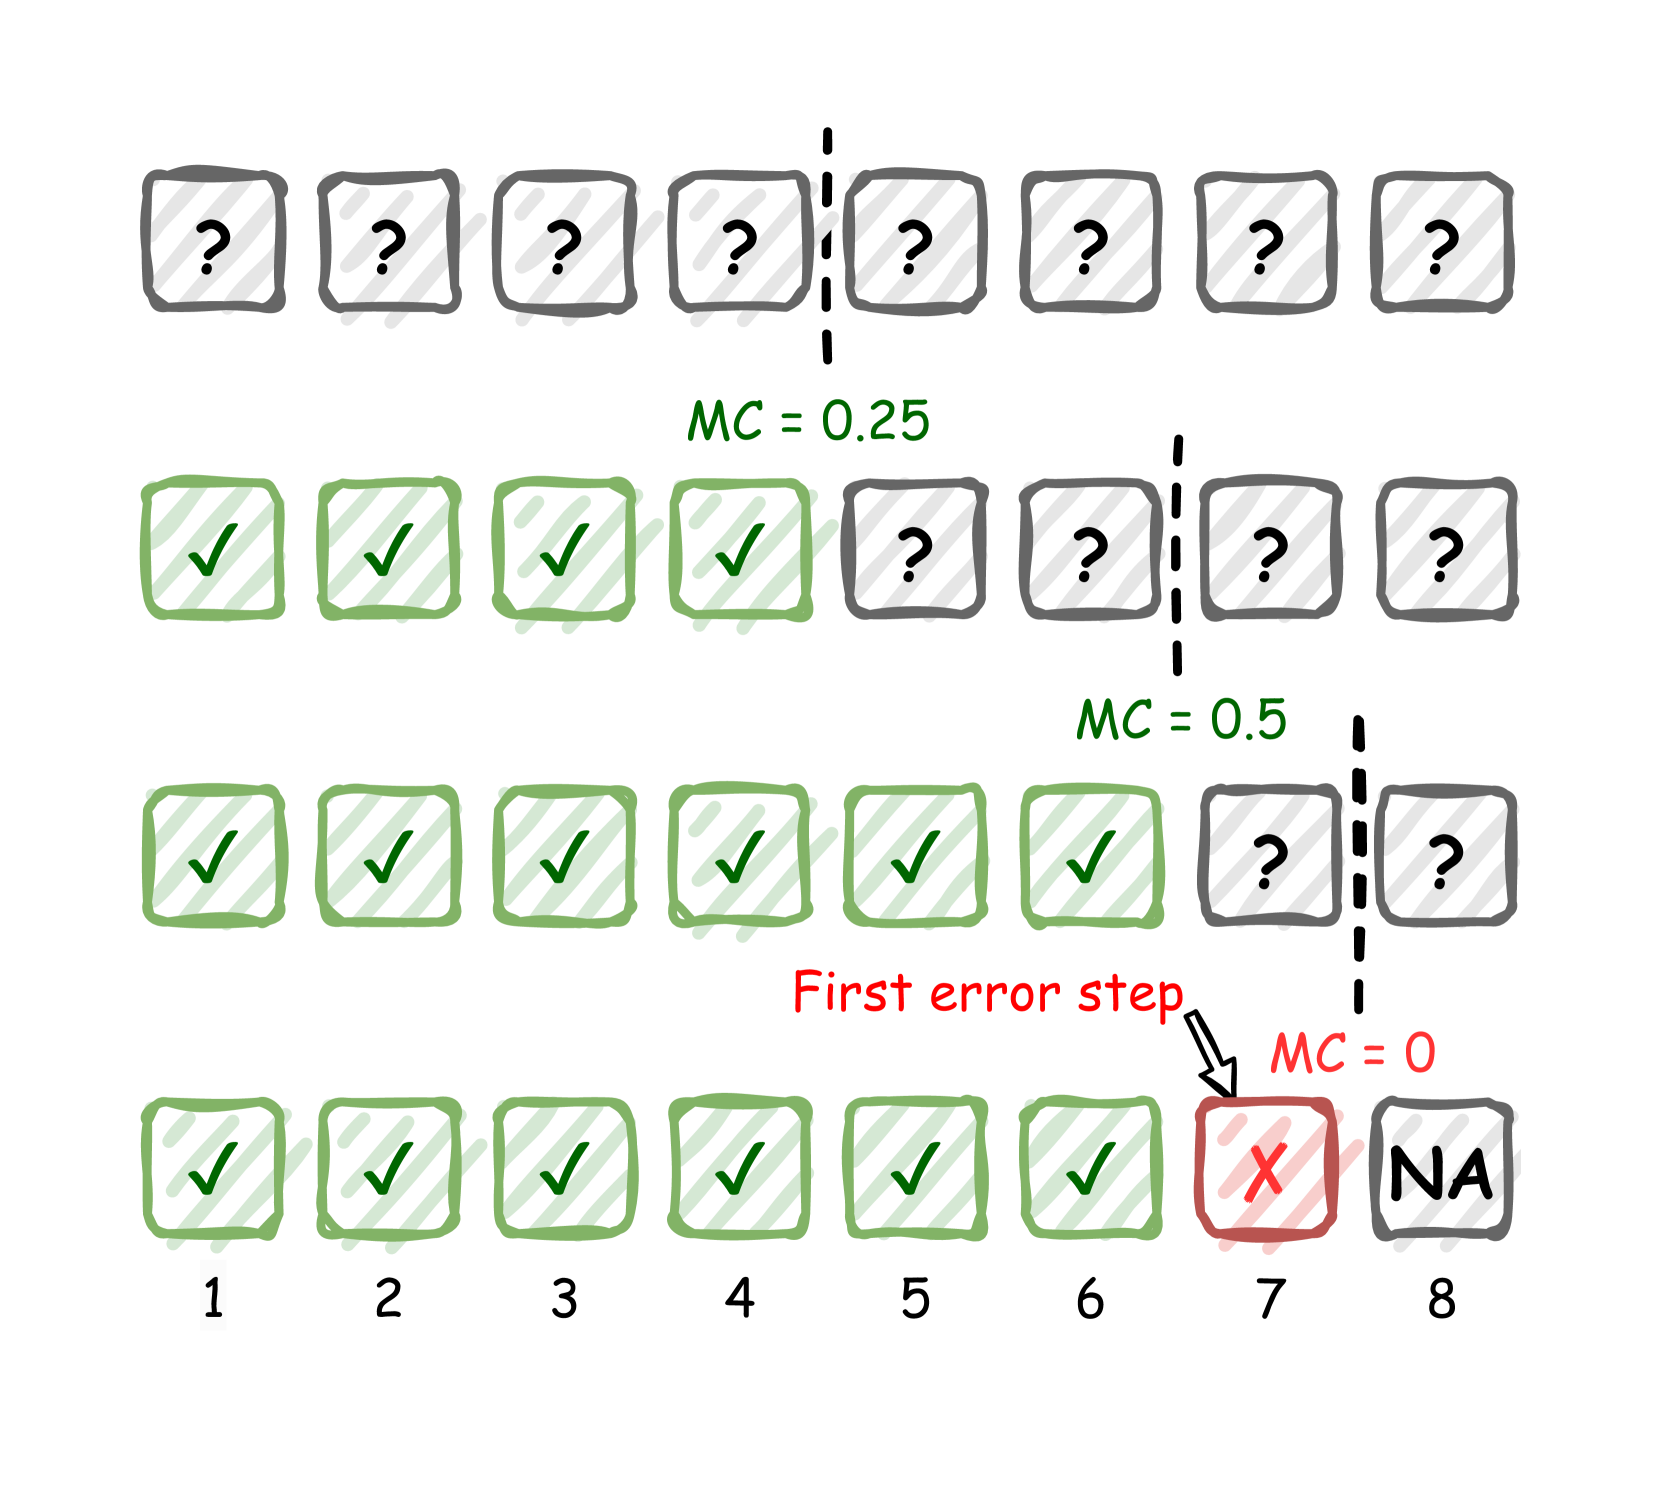
The image depicts a diagram illustrating error propagation across a series of steps. Each step is represented by a square, and the diagram shows how errors accumulate as the process progresses. The diagram consists of four rows of squares, each representing a different stage of the process. The squares contain either a checkmark (indicating a correct step), a question mark (indicating an unknown step), an "X" (indicating an error), or "NA" (indicating not applicable). The diagram also includes labels indicating the "MC" (presumably "Misclassification Count") at different stages.
### Components/Axes
* **Rows:** Four rows representing different stages of the process.
* **Columns:** Eight columns representing individual steps within each stage, numbered 1 through 8.
* **Squares:** Each square represents a step and contains either a checkmark, question mark, "X", or "NA".
* **Labels:** "MC = 0.25", "MC = 0.5", "MC = 0", "First error step".
* **Symbols:** Checkmark (green), Question Mark (grey), X (red), NA (grey).
### Detailed Analysis
* **Row 1:** All eight squares contain question marks.
* **Row 2:** The first four squares contain green checkmarks. The remaining four squares contain question marks. A dashed vertical line separates the fourth and fifth squares, with the label "MC = 0.25" positioned between rows 1 and 2, aligned with the dashed line.
* **Row 3:** The first six squares contain green checkmarks. The last two squares contain question marks. A dashed vertical line separates the sixth and seventh squares, with the label "MC = 0.5" positioned between rows 2 and 3, aligned with the dashed line.
* **Row 4:** The first six squares contain green checkmarks. The seventh square contains a red "X". The eighth square contains "NA". An arrow points from the text "First error step" to the seventh square. A dashed vertical line separates the seventh and eighth squares, with the label "MC = 0" positioned between rows 3 and 4, aligned with the dashed line.
* **Column Labels:** The columns are labeled 1 through 8 along the bottom of the diagram.
### Key Observations
* The process starts with all steps unknown (question marks).
* The process progresses with increasing numbers of correct steps (checkmarks).
* The "MC" value increases as more steps are unknown or incorrect.
* The first error occurs in step 7, as indicated by the red "X".
* The "NA" in step 8 suggests that this step is not applicable after the error in step 7.
### Interpretation
The diagram illustrates how errors can propagate through a multi-step process. Initially, all steps are unknown. As the process progresses, steps are correctly executed (indicated by checkmarks), and the misclassification count (MC) increases as more steps are unknown. The diagram highlights the point at which the first error occurs, leading to a misclassification count of 0. After the error, the subsequent step is deemed not applicable. The diagram demonstrates the importance of error detection and correction in multi-step processes to prevent further errors and ensure accurate results. The increasing MC values suggest a cumulative effect of uncertainty as the process advances.