\n
## Diagram: Monte Carlo Error Introduction
### Overview
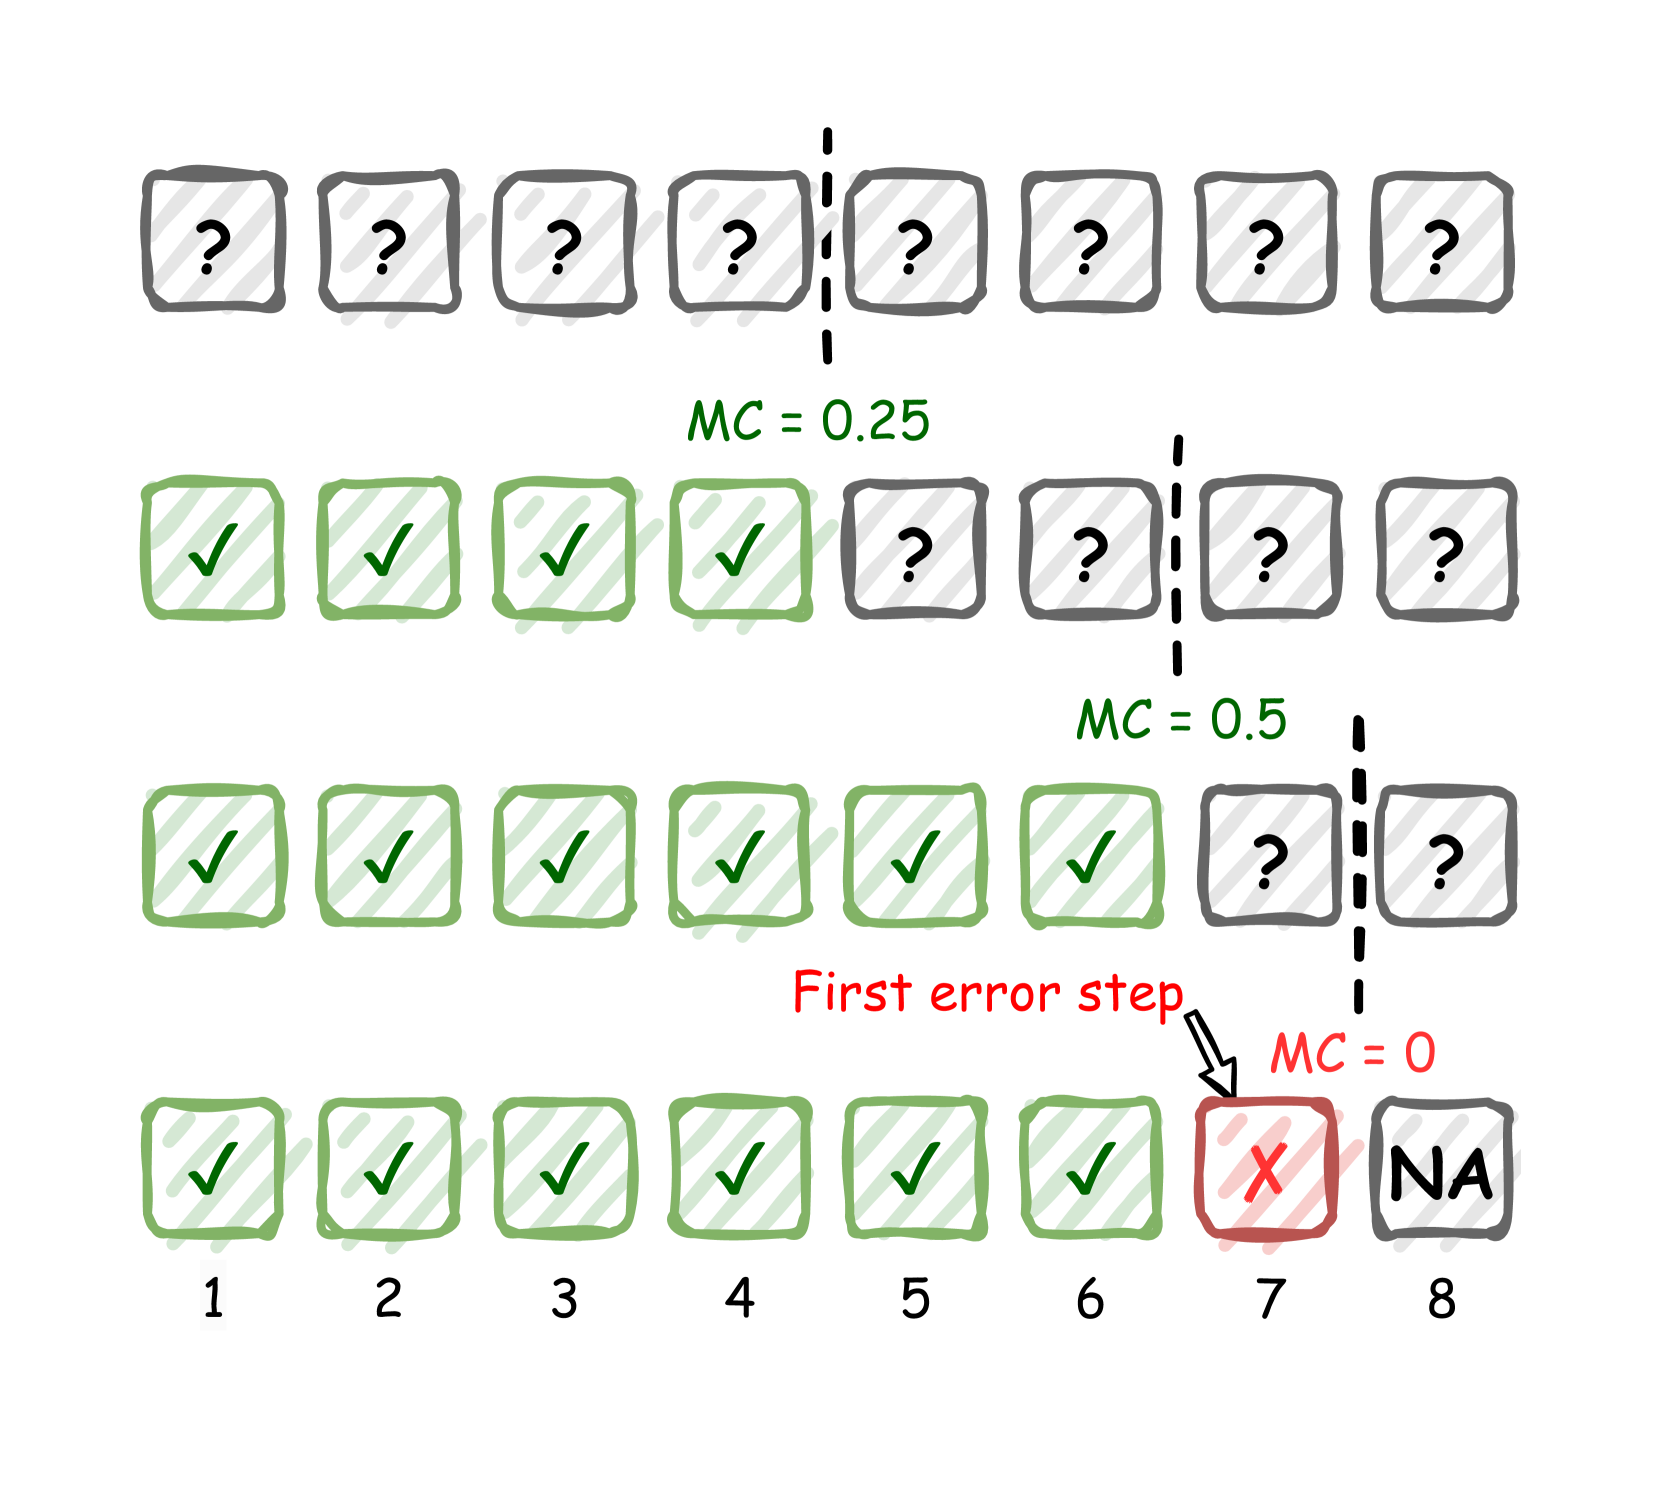
This diagram illustrates the introduction of errors in a Monte Carlo simulation, visualized as a series of steps where correct results ('✓') are progressively replaced with incorrect results ('✗' or 'NA'). The diagram shows how the Monte Carlo confidence (MC) decreases as errors are introduced.
### Components/Axes
The diagram consists of four rows of eight boxes each. Each box contains either a checkmark ('✓'), a question mark ('?'), an 'X', or 'NA'. The horizontal axis represents steps 1 through 8. Vertical rows represent the progression of the simulation. Annotations indicate "MC = 0.25", "MC = 0.5", and "MC = 0". An arrow points to the first error step and is labeled "First error step".
### Detailed Analysis or Content Details
* **Row 1:** All boxes contain question marks ('?').
* **Row 2:** Boxes 1-4 contain checkmarks ('✓'). Boxes 5-8 contain question marks ('?'). Annotation: "MC = 0.25" is positioned between rows 1 and 2, slightly to the right of center.
* **Row 3:** Boxes 1-6 contain checkmarks ('✓'). Boxes 7-8 contain question marks ('?'). Annotation: "MC = 0.5" is positioned between rows 2 and 3, slightly to the right of center.
* **Row 4:** Boxes 1-6 contain checkmarks ('✓'). Box 7 contains an 'X'. Box 8 contains 'NA'. Annotation: "MC = 0" is positioned between rows 3 and 4, pointing to box 7. The annotation "First error step" is positioned above box 7, with an arrow pointing to it.
* **Horizontal Axis:** Labeled with numbers 1 through 8, representing the step number.
### Key Observations
The diagram demonstrates a clear progression of error introduction. Initially, the simulation has an unknown state (row 1). As the simulation progresses (rows 2 & 3), correct results accumulate, increasing the Monte Carlo confidence (MC). The introduction of an error in step 7 (box 7) immediately reduces the MC to 0, and the subsequent step (box 8) is marked as 'NA' (Not Applicable), indicating the simulation is no longer valid.
### Interpretation
This diagram visually represents the sensitivity of Monte Carlo simulations to errors. Even a single error can invalidate the entire simulation, reducing the confidence level to zero. The 'NA' designation in the final step highlights that subsequent calculations based on an erroneous result are meaningless. The diagram emphasizes the importance of error detection and correction in Monte Carlo methods. The MC values (0.25, 0.5, 0) are likely representing the proportion of correct results at each stage, and thus the confidence in the simulation's output. The diagram is a pedagogical tool to illustrate the impact of errors on the reliability of Monte Carlo simulations.