TECHNICAL ASSET FINGERPRINT
34cd5a7e1b76719a14f4b448
Click to view fullscreen
Press ESC or click to close
FOUND IN PAPERS
EXPERT: healer-alpha-free VERSION 1
RUNTIME: free/openrouter/healer-alpha
INTEL_VERIFIED
## Diagram: MC (Margin of Confidence) Progression and Error Impact
### Overview
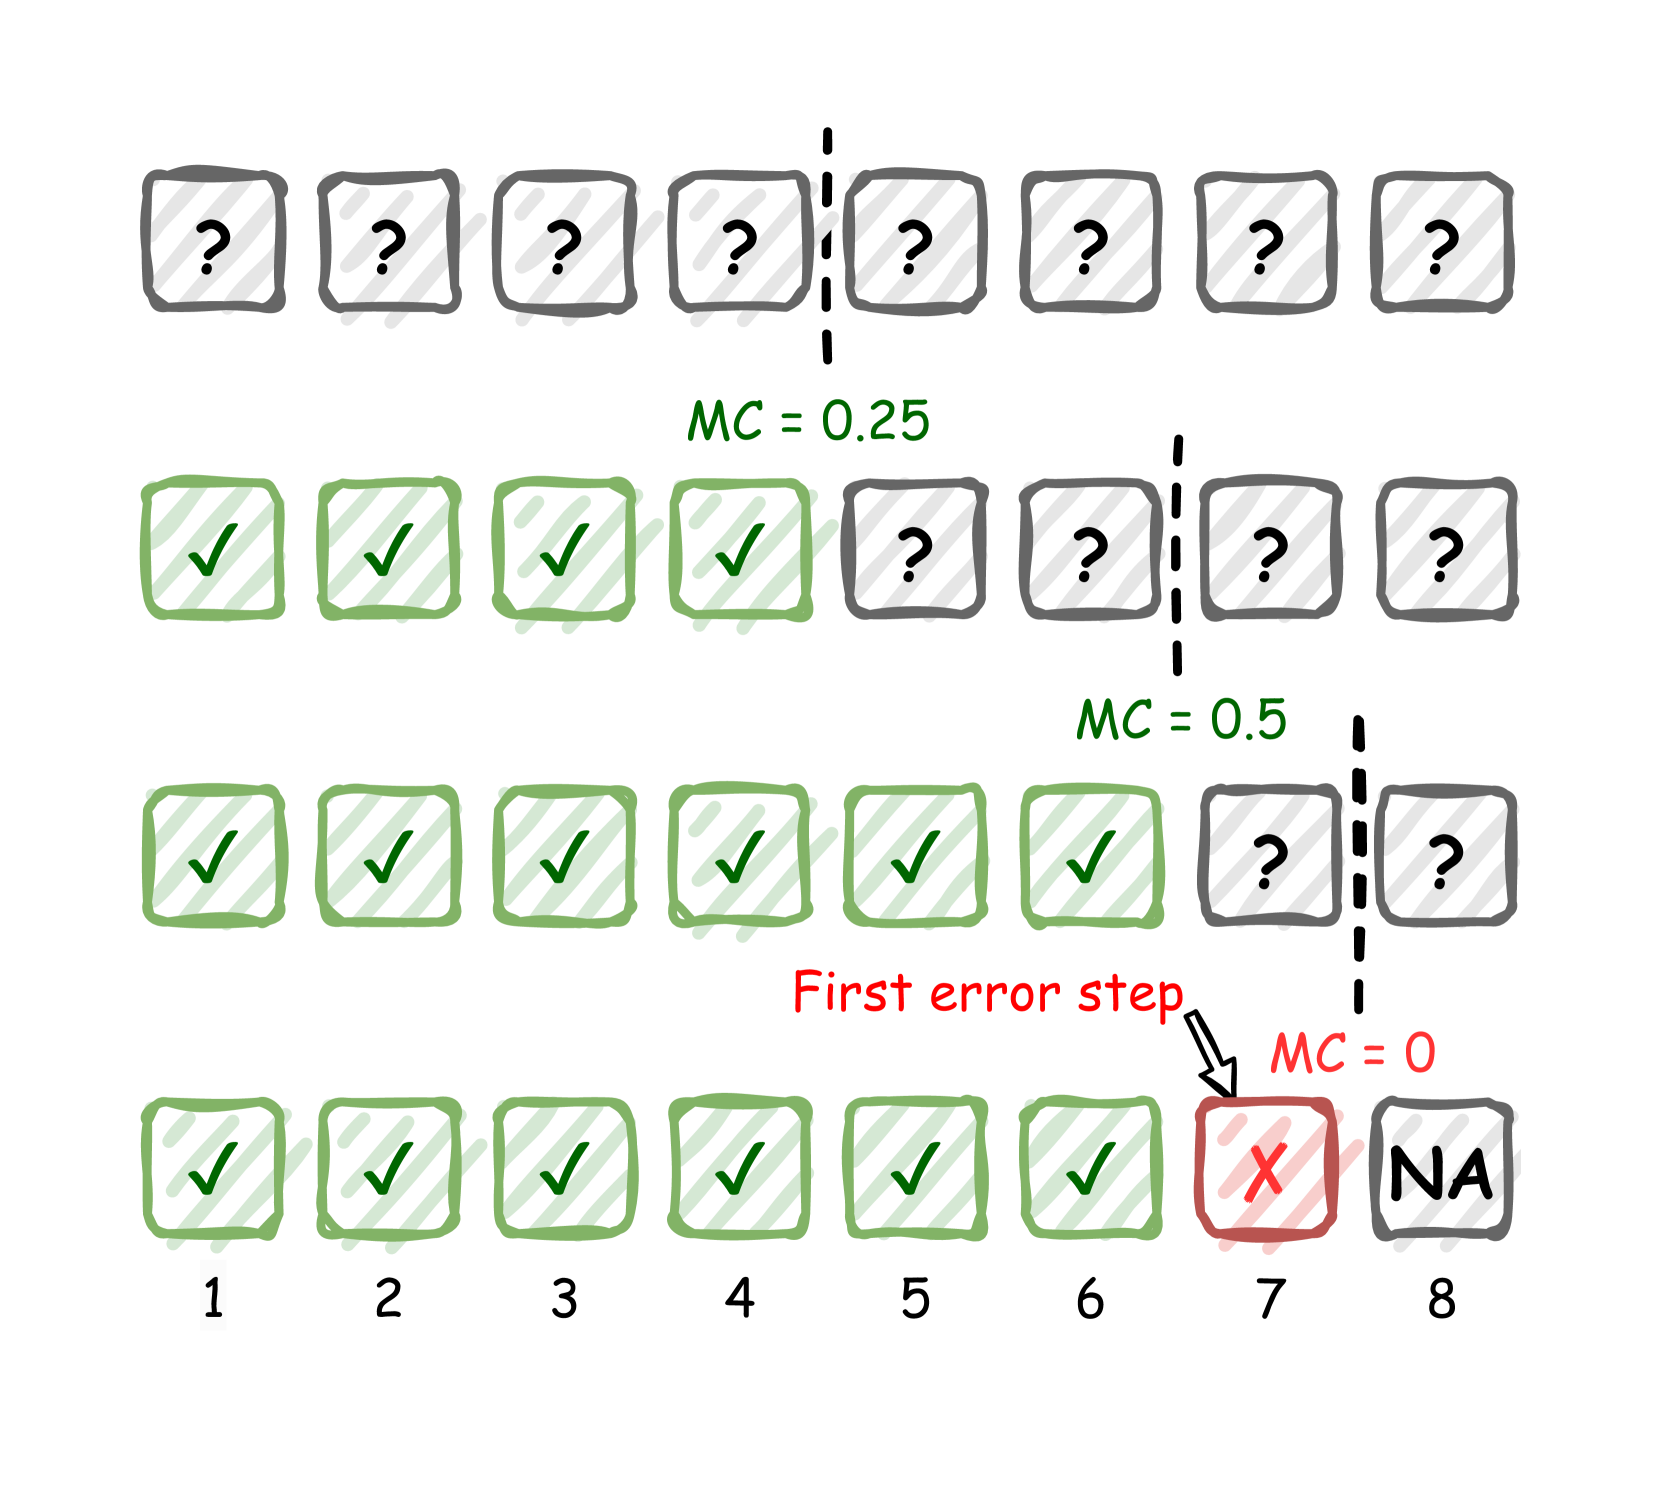
The image is a conceptual diagram illustrating the progression of a metric labeled "MC" (likely "Margin of Confidence" or a similar measure) across a sequence of 8 steps or trials. It visually demonstrates how MC changes based on the accumulation of correct outcomes (checkmarks) and is reset to zero upon the occurrence of a first error (red X). The diagram uses a hand-drawn, sketched aesthetic with boxes, symbols, and annotations.
### Components/Axes
* **Structure:** Four horizontal rows, each containing a sequence of 8 boxes.
* **Box States:**
* **Question Mark (`?`):** Grey box with a black question mark. Represents an unknown, pending, or unattempted step.
* **Checkmark (`✓`):** Green box with a green checkmark. Represents a correct or successful step.
* **Red X (`X`):** Red box with a red "X". Represents an incorrect or failed step.
* **NA:** Grey box with the text "NA". Represents a step that is "Not Applicable" or cannot be evaluated.
* **Annotations:**
* **MC Values:** Green text (`MC = 0.25`, `MC = 0.5`) and red text (`MC = 0`) placed above specific rows.
* **Dashed Vertical Lines:** Black dashed lines separating groups of boxes within a row, indicating a threshold or point of evaluation.
* **"First error step" Label:** Red text with an arrow pointing to the red "X" in the bottom row.
* **Step Numbers:** Black numbers (1 through 8) below the boxes in the bottom row, labeling the sequence position.
* **Spatial Layout:**
* The four rows are stacked vertically.
* The dashed line in the first row is positioned after the 4th box.
* The dashed line in the second row is positioned after the 6th box.
* The dashed line in the third row is positioned after the 7th box.
* The "MC = 0.25" label is centered above the second row.
* The "MC = 0.5" label is centered above the third row.
* The "MC = 0" label and "First error step" annotation are positioned above the 7th box of the bottom row.
### Detailed Analysis
The diagram presents a sequence of four scenarios or states, progressing from top to bottom.
1. **Row 1 (Top):**
* **Content:** 8 boxes, all containing question marks (`?`).
* **Annotation:** A dashed vertical line is placed after the 4th box.
* **MC Value:** No explicit MC value is given for this row.
* **Interpretation:** This represents the initial state where no steps have been attempted or evaluated.
2. **Row 2:**
* **Content:** The first 4 boxes contain checkmarks (`✓`). Boxes 5-8 contain question marks (`?`).
* **Annotation:** A dashed vertical line is placed after the 6th box.
* **MC Value:** `MC = 0.25` (green text).
* **Trend:** The MC value is associated with having 4 correct steps out of the first 6 positions (as indicated by the dashed line). The calculation is not explicitly shown, but 4/6 ≈ 0.67, not 0.25. This suggests MC may be a more complex metric (e.g., confidence margin) rather than a simple accuracy ratio.
3. **Row 3:**
* **Content:** The first 6 boxes contain checkmarks (`✓`). Boxes 7-8 contain question marks (`?`).
* **Annotation:** A dashed vertical line is placed after the 7th box.
* **MC Value:** `MC = 0.5` (green text).
* **Trend:** The MC value has increased from 0.25 to 0.5 as the number of consecutive correct steps increased from 4 to 6. The evaluation point (dashed line) has also moved one step to the right.
4. **Row 4 (Bottom):**
* **Content:** Boxes 1-6 contain checkmarks (`✓`). Box 7 contains a red "X". Box 8 contains "NA".
* **Step Labels:** Numbers 1 through 8 are placed below the boxes.
* **Annotations:** A red arrow labeled "First error step" points to the red "X" in box 7. The text `MC = 0` (red) is placed above this box.
* **Trend:** The sequence of correct steps is broken at step 7. The MC value drops to 0 immediately upon the first error. Step 8 is marked "NA", implying the process terminates or the metric is undefined after a failure.
### Key Observations
1. **MC is Reset by Error:** The most critical observation is that a single error (the red "X" at step 7) causes the MC value to drop to zero (`MC = 0`), regardless of the prior streak of correct answers.
2. **MC Increases with Success:** In the error-free scenarios (Rows 2 and 3), the MC value increases (from 0.25 to 0.5) as the number of consecutive correct steps increases.
3. **Evaluation Point Shifts:** The dashed vertical line, which likely marks the point at which MC is calculated, moves to the right as more steps are completed correctly (from after step 4, to after step 6, to after step 7).
4. **Termination on Failure:** The "NA" in the final box of the bottom row suggests that the process or metric calculation stops after an error occurs.
5. **Non-Linear MC Calculation:** The MC values (0.25 for 4/6 correct, 0.5 for 6/7 correct) do not correspond directly to the proportion of correct steps, indicating it is a derived metric, possibly a confidence score or margin.
### Interpretation
This diagram is a pedagogical tool explaining the behavior of a sequential evaluation metric, likely used in fields like machine learning (e.g., reinforcement learning, confidence calibration), quality control, or testing protocols.
* **What it Demonstrates:** It illustrates a "streak-based" or "consecutive success" confidence model. The system's confidence (MC) builds gradually with each correct outcome but is fragile—a single failure completely resets confidence to zero. This models a strict, perhaps conservative, evaluation where reliability is defined by perfect performance up to a point.
* **Relationship Between Elements:** The rows show a temporal progression. The dashed line represents the "current evaluation point." The MC value is a function of the history of outcomes *up to that point*. The final row shows the catastrophic effect of an error on this specific metric.
* **Notable Implications:**
* **Fragility:** The metric is highly sensitive to the most recent outcome. A long history of success is invalidated by one mistake.
* **All-or-Nothing:** It suggests a system where partial success is not valued; only perfect sequences contribute to a positive MC.
* **Process Termination:** The "NA" implies that after a failure, the subsequent step may not be attempted or the metric is no longer meaningful, highlighting a potential stopping condition in the underlying process.
In essence, the diagram argues for a specific, stringent definition of confidence or reliability where it is earned incrementally but lost instantly.
DECODING INTELLIGENCE...