## Diagram: Process Validation with Monte Carlo Confidence (MC) Thresholds
### Overview
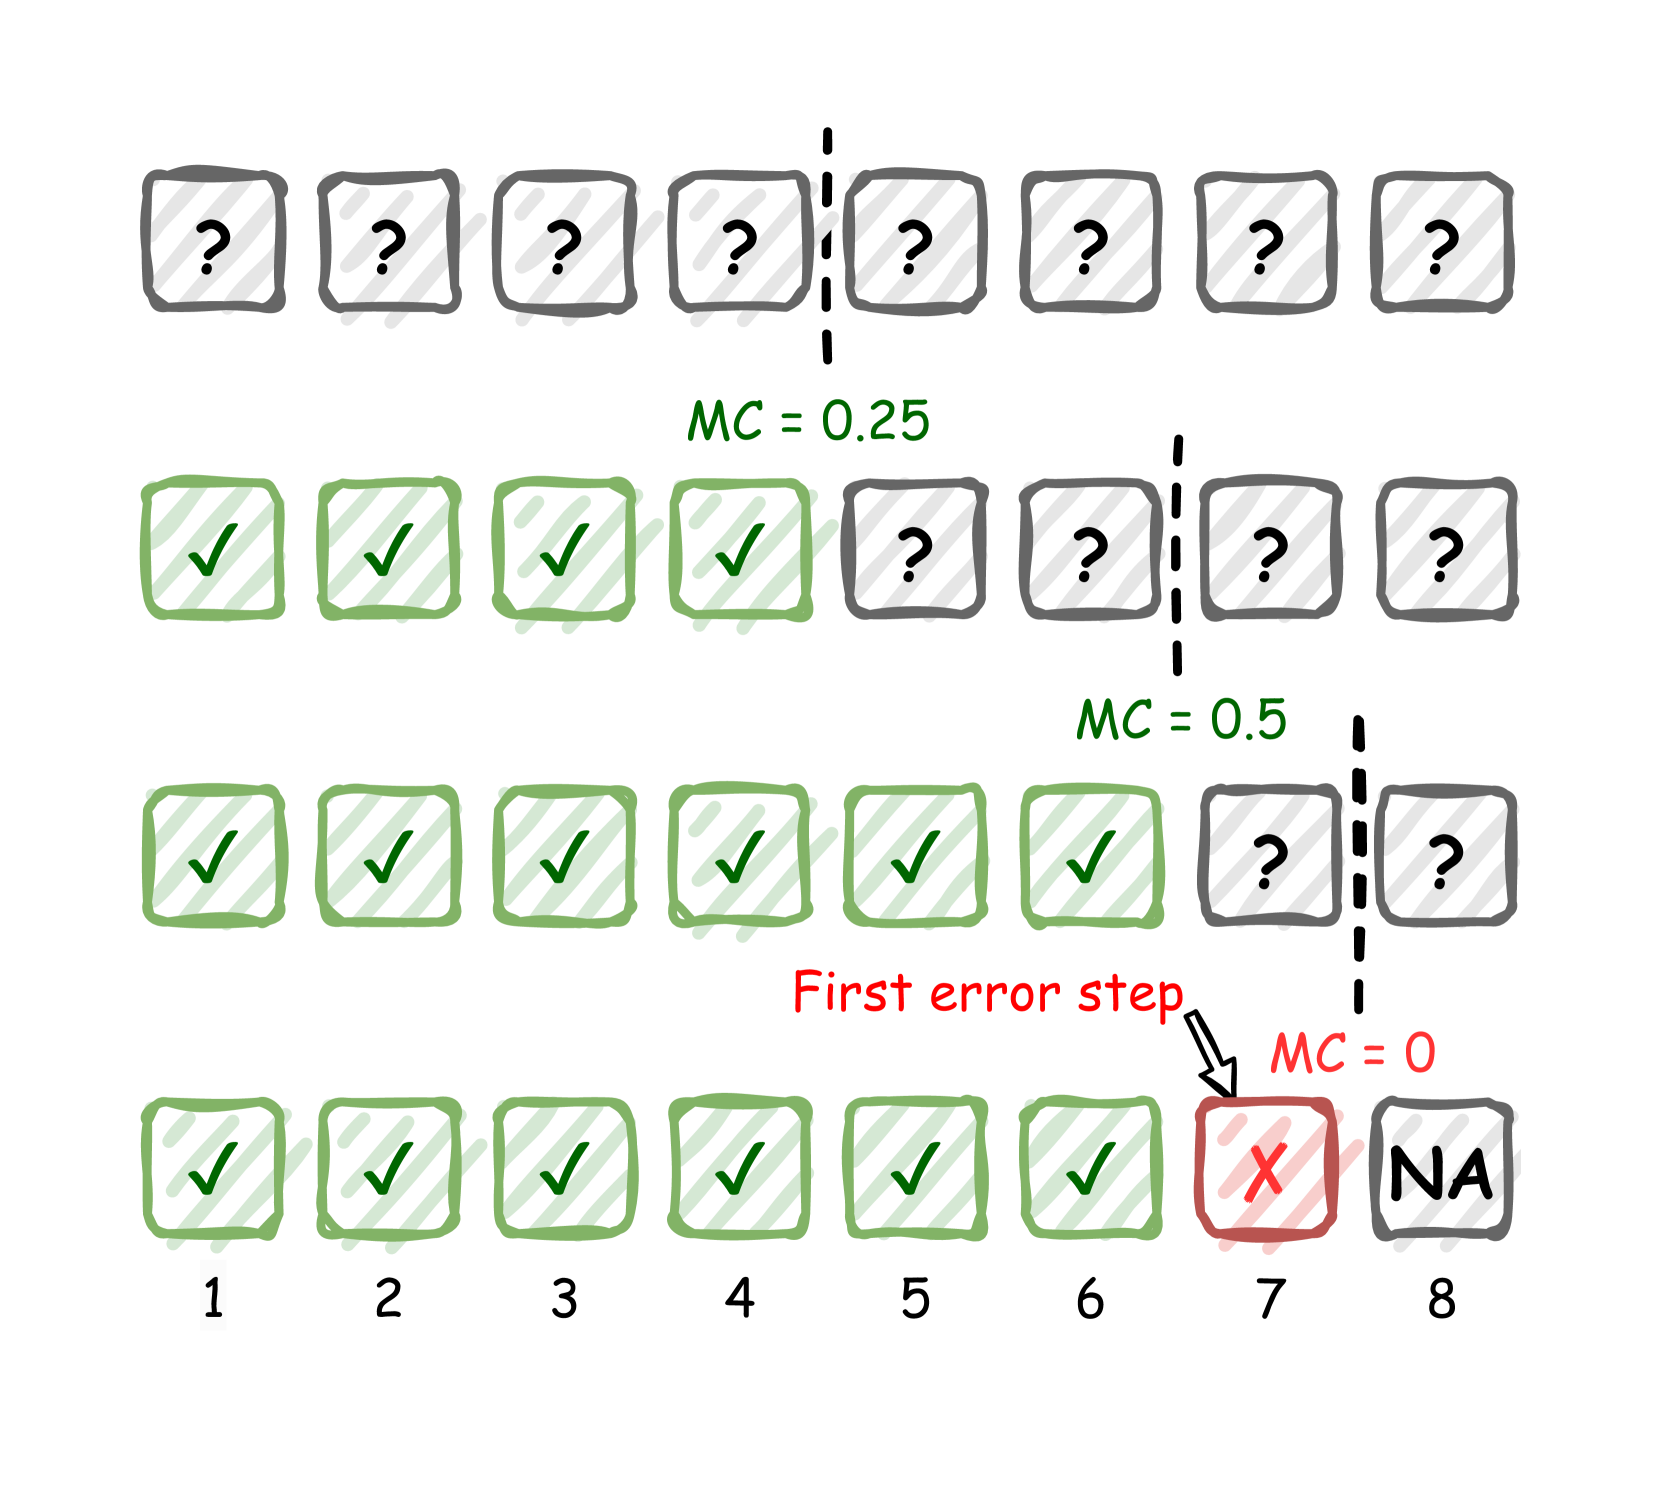
The diagram illustrates a sequential process validation workflow using Monte Carlo confidence (MC) thresholds. It consists of four horizontal rows of 8 boxes each, representing discrete steps in a process. Each row corresponds to a specific MC threshold (0.25, 0.5, 0), with visual indicators for correct steps (✓), uncertain steps (?), errors (×), and terminal states (NA). The "First error step" is explicitly marked with an arrow and red highlighting.
### Components/Axes
- **Rows**:
- Row 1: MC = 0.25 (all steps marked with ?)
- Row 2: MC = 0.5 (first 4 steps ✓, next 4 ?)
- Row 3: MC = 0.5 (first 6 steps ✓, next 2 ?)
- Row 4: MC = 0 (first 6 steps ✓, step 7 ×, step 8 NA)
- **Columns**: Numbered 1–8 at the bottom, representing sequential steps.
- **Legend**:
- Green ✓: Confirmed correct step
- Gray ? : Uncertain/untested step
- Red × : Error detected
- NA: Not Applicable/Process Terminated
- **Annotations**:
- "First error step" (red arrow pointing to step 7 in Row 4)
- MC values labeled above each row
### Detailed Analysis
1. **Row 1 (MC = 0.25)**:
- All 8 steps marked with ?, indicating no confirmed correct steps at this threshold.
- Spatial grounding: Topmost row, MC label centered above.
2. **Row 2 (MC = 0.5)**:
- First 4 steps (1–4) marked ✓, next 4 steps (5–8) marked ?.
- Spatial grounding: Second row from top, MC label centered above.
3. **Row 3 (MC = 0.5)**:
- First 6 steps (1–6) marked ✓, steps 7–8 marked ?.
- Spatial grounding: Third row from top, MC label centered above.
4. **Row 4 (MC = 0)**:
- Steps 1–6 marked ✓, step 7 marked × (first error), step 8 marked NA.
- Spatial grounding: Bottom row, MC label centered above.
- Red arrow labeled "First error step" points from text to step 7.
### Key Observations
- **MC Threshold Correlation**: Higher MC values (0.5) correspond to more confirmed correct steps before uncertainty (?) or error (×) occurs.
- **Error Progression**: The first error occurs at step 7 in the lowest MC threshold (0), suggesting errors become inevitable as confidence drops.
- **Terminal State**: Step 8 in Row 4 is marked NA, indicating process termination after the first error.
- **Anomaly**: Row 3 (MC = 0.5) shows 6 confirmed steps despite the same MC as Row 2, which only confirms 4 steps. This may imply non-linear relationships between MC and step validation.
### Interpretation
This diagram demonstrates a probabilistic workflow where:
1. **Confidence Degradation**: As MC thresholds decrease (0.25 → 0), the number of confirmed correct steps before uncertainty/error increases, but the error becomes inevitable at MC = 0.
2. **Process Failure Point**: The "First error step" at MC = 0 (step 7) acts as a critical failure threshold, after which the process is deemed invalid (NA).
3. **Non-Linear Behavior**: The discrepancy between Rows 2 and 3 (same MC = 0.5 but different confirmed steps) suggests MC thresholds may interact with step-specific probabilities or external factors not explicitly labeled.
The diagram emphasizes the importance of MC thresholds in process validation, highlighting how lower confidence levels correlate with earlier failure points. The NA designation in step 8 reinforces that errors propagate terminal states, halting further validation.