## Diagram: Multi-Layer Computational Graph Architecture
### Overview
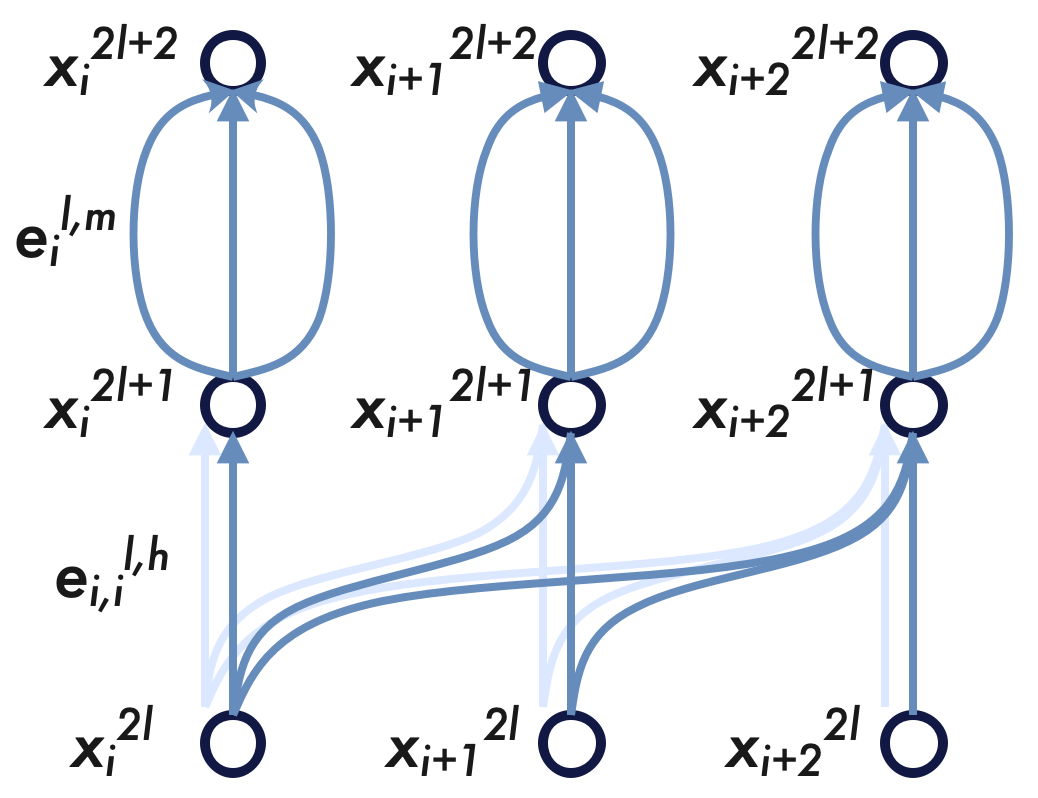
This image is a technical diagram illustrating the flow of data through a computational graph, likely representing a specific architecture of a Neural Network (such as a Graph Neural Network or a Transformer variant). It shows three sequential states (layers) across three distinct spatial or sequence positions, detailing how information is passed and transformed between nodes.
### Components and Notation
* **Nodes:** Represented by dark blue circles with white centers. They are labeled with the variable $x$, featuring a subscript for the spatial/sequence index ($i$, $i+1$, $i+2$) and a superscript for the layer/time step ($2l$, $2l+1$, $2l+2$).
* **Edges (Connections):** Represented by directed arrows indicating the flow of information from bottom to top. There are solid blue arrows (primary data flow) and faint light-blue arrows (secondary or background connections).
* **Edge Labels:** Denoted by the variable $\mathbf{e}$, featuring subscripts for node indices and superscripts indicating layer ($l$) and specific operation types ($h$, $m$).
### Content Details
To ensure accuracy, the diagram is segmented into three horizontal layers and the connections between them.
#### 1. Node Layers (Spatial Grounding)
* **Bottom Layer (Input/Initial State):** Located at the bottom of the image. Contains three nodes from left to right:
* $x_i^{2l}$ (bottom-left)
* $x_{i+1}^{2l}$ (bottom-center)
* $x_{i+2}^{2l}$ (bottom-right)
* **Middle Layer (Intermediate State):** Located in the horizontal center. Contains three nodes:
* $x_i^{2l+1}$ (center-left)
* $x_{i+1}^{2l+1}$ (center)
* $x_{i+2}^{2l+1}$ (center-right)
* **Top Layer (Output/Final State):** Located at the top of the image. Contains three nodes:
* $x_i^{2l+2}$ (top-left)
* $x_{i+1}^{2l+2}$ (top-center)
* $x_{i+2}^{2l+2}$ (top-right)
#### 2. Lower Connections (Flow from $2l$ to $2l+1$)
* **Visual Flow:** Information flows upward from the bottom layer to the middle layer.
* **Node $i$ Connectivity:** The bottom-left node ($x_i^{2l}$) broadcasts information to *all three* nodes in the middle layer. This is shown by a straight solid blue arrow pointing up to $x_i^{2l+1}$, and two curved solid blue arrows pointing to $x_{i+1}^{2l+1}$ and $x_{i+2}^{2l+1}$.
* **Node $i+1$ and $i+2$ Connectivity:** The bottom-center ($x_{i+1}^{2l}$) and bottom-right ($x_{i+2}^{2l}$) nodes only send information straight up to their direct counterparts ($x_{i+1}^{2l+1}$ and $x_{i+2}^{2l+1}$) via single, straight solid blue arrows.
* **Faint Arrows:** Behind the solid arrows originating from $x_i^{2l}$, there are faint light-blue arrows mirroring the exact same paths. There are also faint straight vertical arrows for the $i+1$ and $i+2$ columns.
* **Label:** Positioned in the lower-left quadrant, next to the connections originating from the first node, is the label: **$\mathbf{e}_{i,i}^{l,h}$**
#### 3. Upper Connections (Flow from $2l+1$ to $2l+2$)
* **Visual Flow:** Information flows upward from the middle layer to the top layer.
* **Isolated Column Connectivity:** Unlike the lower section, there is no cross-talk between the columns here. Each node in the middle layer connects *only* to the node directly above it.
* **Multi-Path Edges:** The connection between each middle node and its top counterpart consists of three distinct arrows: one straight vertical arrow in the center, flanked by two curved arrows forming an oval/ellipse shape. This pattern is identical across all three columns.
* **Label:** Positioned in the upper-left quadrant, next to the multi-path connection of the first column, is the label: **$\mathbf{e}_i^{l,m}$**
### Key Observations
* **Asymmetry in the Lower Half:** The communication in the first transition ($2l \rightarrow 2l+1$) is highly asymmetric. Node $i$ acts as a source broadcasting to multiple destinations, while nodes $i+1$ and $i+2$ do not broadcast laterally.
* **Symmetry in the Upper Half:** The second transition ($2l+1 \rightarrow 2l+2$) is perfectly symmetric and isolated per column, applying the exact same multi-path operation to each node independently.
* **Layer Progression:** The superscripts indicate that a single main layer block ($l$) is composed of two distinct sub-steps (progressing from $2l$ to $2l+1$, and then to $2l+2$).
### Interpretation
This diagram illustrates a two-step update mechanism within a single layer (layer $l$) of a complex neural network, likely a Graph Neural Network (GNN) or a specialized Transformer.
1. **Step 1 (Lower Half - Inter-node Communication):** The transition from $2l$ to $2l+1$ represents a message-passing or attention phase. The label $\mathbf{e}_{i,i}^{l,h}$ (where $h$ likely denotes an attention "head" or specific edge type) points to this mechanism. The fact that node $i$ connects to $i$, $i+1$, and $i+2$ suggests a directed graph topology or a specific masking strategy (e.g., a causal mask where a past node influences future nodes, or a central node broadcasting to neighbors). The faint arrows likely represent the *potential* fully-connected graph, while the solid dark arrows represent the *active* edges or the specific attention weights being applied in this instance.
2. **Step 2 (Upper Half - Intra-node/Multi-relational Update):** The transition from $2l+1$ to $2l+2$ represents a point-wise or edge-feature update. Because there is no lateral communication, this operation is applied to each node's state independently. The three parallel arrows and the label $\mathbf{e}_i^{l,m}$ (where $m$ might denote "multi-relational" or "message") suggest that multiple distinct transformations, edge types, or relations are being computed and aggregated between the intermediate state and the final state of that specific node.
3. **Overall Architecture:** The diagram reads as a block that first mixes information across spatial/sequence positions (message passing), followed by a complex, multi-faceted feature transformation applied independently to each position (similar to a multi-path Feed-Forward Network).