\n
## Diagram: State Transition Diagram
### Overview
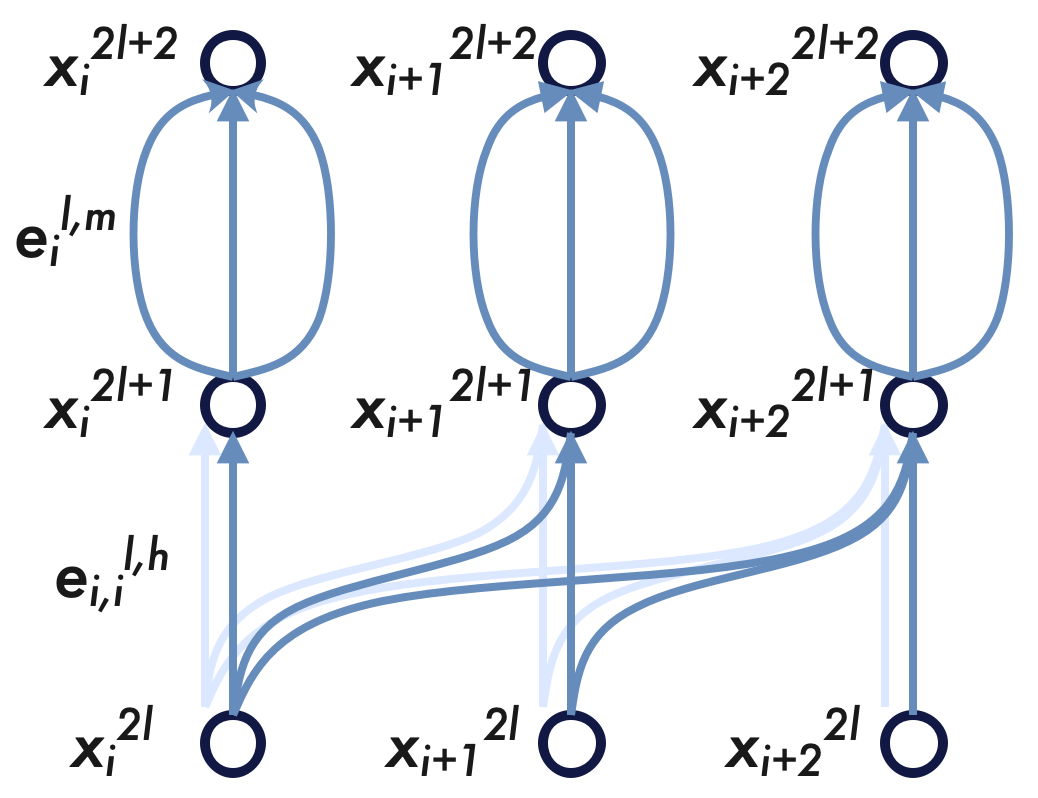
The image depicts a state transition diagram illustrating a system with three states per element, labeled with indices `i`, `i+1`, and `i+2`, and levels `2l`, `2l+1`, and `2l+2`. Transitions between these states are indicated by arrows, with two types of transitions labeled `eᵢ,l,m` and `eᵢ,l,h`. The diagram shows a repeating pattern across multiple elements.
### Components/Axes
The diagram consists of:
* **States:** Represented by circles, labeled as `xᵢ²ˡ`, `xᵢ²ˡ⁺¹`, `xᵢ²ˡ⁺²`, `xᵢ₊₁²ˡ`, `xᵢ₊₁²ˡ⁺¹`, `xᵢ₊₁²ˡ⁺²`, `xᵢ₊₂²ˡ`, `xᵢ₊₂²ˡ⁺¹`, `xᵢ₊₂²ˡ⁺²`.
* **Transitions:** Represented by curved arrows connecting the states.
* **Transition Labels:** Two types of transitions are labeled: `eᵢ,l,m` (dark blue arrows) and `eᵢ,l,h` (light blue arrows).
* **Spatial Arrangement:** The diagram is arranged in three columns, each representing a different element (i, i+1, i+2). Within each column, the states are vertically stacked, representing the different levels (2l, 2l+1, 2l+2).
### Detailed Analysis
The diagram shows a repeating pattern of state transitions. Let's analyze the transitions for each element:
* **Element i:**
* `xᵢ²ˡ` transitions to `xᵢ²ˡ⁺¹` via `eᵢ,l,h` (light blue).
* `xᵢ²ˡ⁺¹` transitions to `xᵢ²ˡ⁺²` via `eᵢ,l,m` (dark blue).
* `xᵢ²ˡ⁺²` transitions to `xᵢ²ˡ` via a light blue arrow (labeled `eᵢ,l,m`).
* **Element i+1:**
* `xᵢ₊₁²ˡ` transitions to `xᵢ₊₁²ˡ⁺¹` via `eᵢ,l,h` (light blue).
* `xᵢ₊₁²ˡ⁺¹` transitions to `xᵢ₊₁²ˡ⁺²` via `eᵢ,l,m` (dark blue).
* `xᵢ₊₁²ˡ⁺²` transitions to `xᵢ₊₁²ˡ` via a light blue arrow (labeled `eᵢ,l,m`).
* **Element i+2:**
* `xᵢ₊₂²ˡ` transitions to `xᵢ₊₂²ˡ⁺¹` via `eᵢ,l,h` (light blue).
* `xᵢ₊₂²ˡ⁺¹` transitions to `xᵢ₊₂²ˡ⁺²` via `eᵢ,l,m` (dark blue).
* `xᵢ₊₂²ˡ⁺²` transitions to `xᵢ₊₂²ˡ` via a light blue arrow (labeled `eᵢ,l,m`).
Additionally, there are transitions *between* elements:
* `xᵢ²ˡ⁺¹` transitions to `xᵢ₊₁²ˡ⁺¹` via a dark blue arrow (labeled `eᵢ,l,m`).
* `xᵢ²ˡ⁺²` transitions to `xᵢ₊₁²ˡ⁺²` via a dark blue arrow (labeled `eᵢ,l,m`).
* `xᵢ₊₁²ˡ⁺¹` transitions to `xᵢ₊₂²ˡ⁺¹` via a dark blue arrow (labeled `eᵢ,l,m`).
* `xᵢ₊₁²ˡ⁺²` transitions to `xᵢ₊₂²ˡ⁺²` via a dark blue arrow (labeled `eᵢ,l,m`).
* `xᵢ²ˡ` transitions to `xᵢ₊₁²ˡ` via a light blue arrow (labeled `eᵢ,l,h`).
* `xᵢ₊₁²ˡ` transitions to `xᵢ₊₂²ˡ` via a light blue arrow (labeled `eᵢ,l,h`).
### Key Observations
* The diagram exhibits a cyclical pattern within each element, with transitions between states `2l`, `2l+1`, and `2l+2`.
* There are two types of transitions: `eᵢ,l,m` (dark blue) and `eᵢ,l,h` (light blue).
* Transitions `eᵢ,l,m` appear to connect states across different elements, while `eᵢ,l,h` transitions primarily occur within the same element.
* The diagram suggests a system where states are updated sequentially across elements.
### Interpretation
This diagram likely represents a computational process or a physical system with discrete states. The states `xᵢ²ˡ`, `xᵢ²ˡ⁺¹`, and `xᵢ²ˡ⁺²` could represent different values or configurations of a variable at different time steps or positions. The transitions `eᵢ,l,m` and `eᵢ,l,h` represent the rules or mechanisms that govern how the system evolves from one state to another.
The repeating pattern across elements `i`, `i+1`, and `i+2` suggests a wave-like propagation or a sequential processing of information. The two types of transitions (`eᵢ,l,m` and `eᵢ,l,h`) could represent different types of interactions or updates. For example, `eᵢ,l,m` might represent a long-range interaction or a global update, while `eᵢ,l,h` might represent a local interaction or a short-range update.
The cyclical nature of the transitions within each element suggests that the system is stable and will continue to evolve in a predictable manner. The diagram could be used to model a variety of phenomena, such as signal processing, cellular automata, or the dynamics of a physical system. The diagram does not provide any numerical data, so it is difficult to make more specific interpretations. It is a qualitative representation of a system's behavior.