## Diagram: Mathematical State Transition Model
### Overview
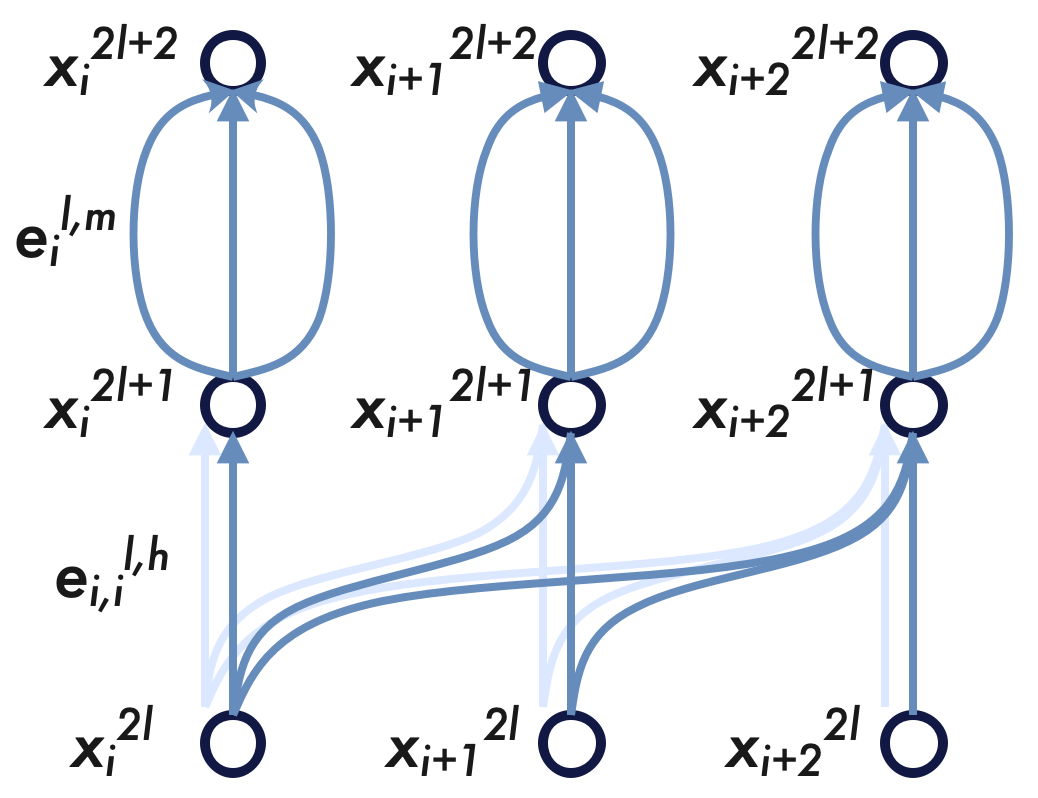
The image depicts a directed graph with nodes labeled using mathematical expressions and arrows representing transitions between states. The diagram uses a grid-like structure with three columns and three rows, where nodes are connected via labeled edges. The labels on nodes and edges suggest a hierarchical or iterative process, possibly related to computational or mathematical modeling.
### Components/Axes
- **Nodes**:
- Labeled with expressions like `x_i^2l`, `x_i+1^2l+1`, `x_i+2^2l+2`, etc.
- Subscripts and superscripts indicate indices (`i`, `l`, `m`, `h`) and exponents (`2l`, `2l+1`, `2l+2`).
- **Edges**:
- Labeled `e_i,l,m` and `e_i,l,h`, with arrows indicating direction.
- Colors: Light blue (e_i,l,h) and dark blue (e_i,l,m), though no explicit legend is present.
- **Spatial Layout**:
- Nodes are arranged in a 3x3 grid.
- Arrows connect nodes in a structured pattern (e.g., vertical, horizontal, and diagonal).
### Detailed Analysis
- **Node Labels**:
- `x_i^2l`: Base state with index `i` and exponent `2l`.
- `x_i+1^2l+1`: Next state in the sequence, with incremented index and exponent.
- `x_i+2^2l+2`: Further state with additional increments.
- **Edge Labels**:
- `e_i,l,h`: Likely represents a "horizontal" or "high" transition (based on subscript `h`).
- `e_i,l,m`: Likely represents a "middle" or "main" transition (based on subscript `m`).
- **Flow Pattern**:
- Vertical connections: `x_i^2l` → `x_i^2l+1` → `x_i^2l+2` via `e_i,l,h`.
- Horizontal connections: `x_i^2l+1` → `x_i+1^2l+1` via `e_i,l,h`, then `x_i+1^2l+1` → `x_i+1^2l+2` via `e_i,l,m`.
- Diagonal connections: `x_i^2l+1` → `x_i+1^2l+1` via `e_i,l,h`, and `x_i+1^2l+1` → `x_i+2^2l+1` via `e_i,l,h`.
### Key Observations
- **Hierarchical Structure**: Nodes are organized in a grid, suggesting a multi-level or multi-stage process.
- **Transition Types**: Two distinct edge types (`e_i,l,h` and `e_i,l,m`) imply different transition mechanisms or priorities.
- **Indexing**: The use of `i`, `l`, `m`, `h` suggests parameters or variables that may vary across iterations or dimensions.
### Interpretation
This diagram likely represents a **state transition model** in a computational or mathematical context. The nodes (`x_i^2l`, etc.) could represent states or variables in a system, while the edges (`e_i,l,h`, `e_i,l,m`) denote transitions between these states. The hierarchical indexing (e.g., `2l`, `2l+1`, `2l+2`) suggests a recursive or iterative process, possibly related to algorithms, data structures, or dynamical systems.
- **Flow Logic**:
- Vertical transitions (`e_i,l,h`) may represent incremental updates within a single index (`i`).
- Horizontal transitions (`e_i,l,h`, `e_i,l,m`) could indicate interactions between adjacent indices (`i` → `i+1`).
- **Potential Applications**:
- **Algorithm Design**: Modeling steps in a sorting or search algorithm.
- **Mathematical Proofs**: Visualizing inductive steps or recursive relationships.
- **System Dynamics**: Representing state changes in a control system or network.
- **Notable Patterns**:
- The diagram emphasizes **sequential progression** (e.g., `x_i^2l` → `x_i^2l+1` → `x_i^2l+2`).
- The use of `e_i,l,h` and `e_i,l,m` implies **differentiated transition rules** (e.g., "high" vs. "middle" priority).
### Limitations
- No explicit legend is provided, so the meaning of edge colors (light blue vs. dark blue) remains ambiguous.
- The diagram lacks numerical values or quantitative data, focusing instead on symbolic relationships.
This structure suggests a formalized model for analyzing transitions in a system, with clear emphasis on indexing and hierarchical relationships.