# Technical Document Extraction: Control Effect Analysis
## Line Charts (Left Section)
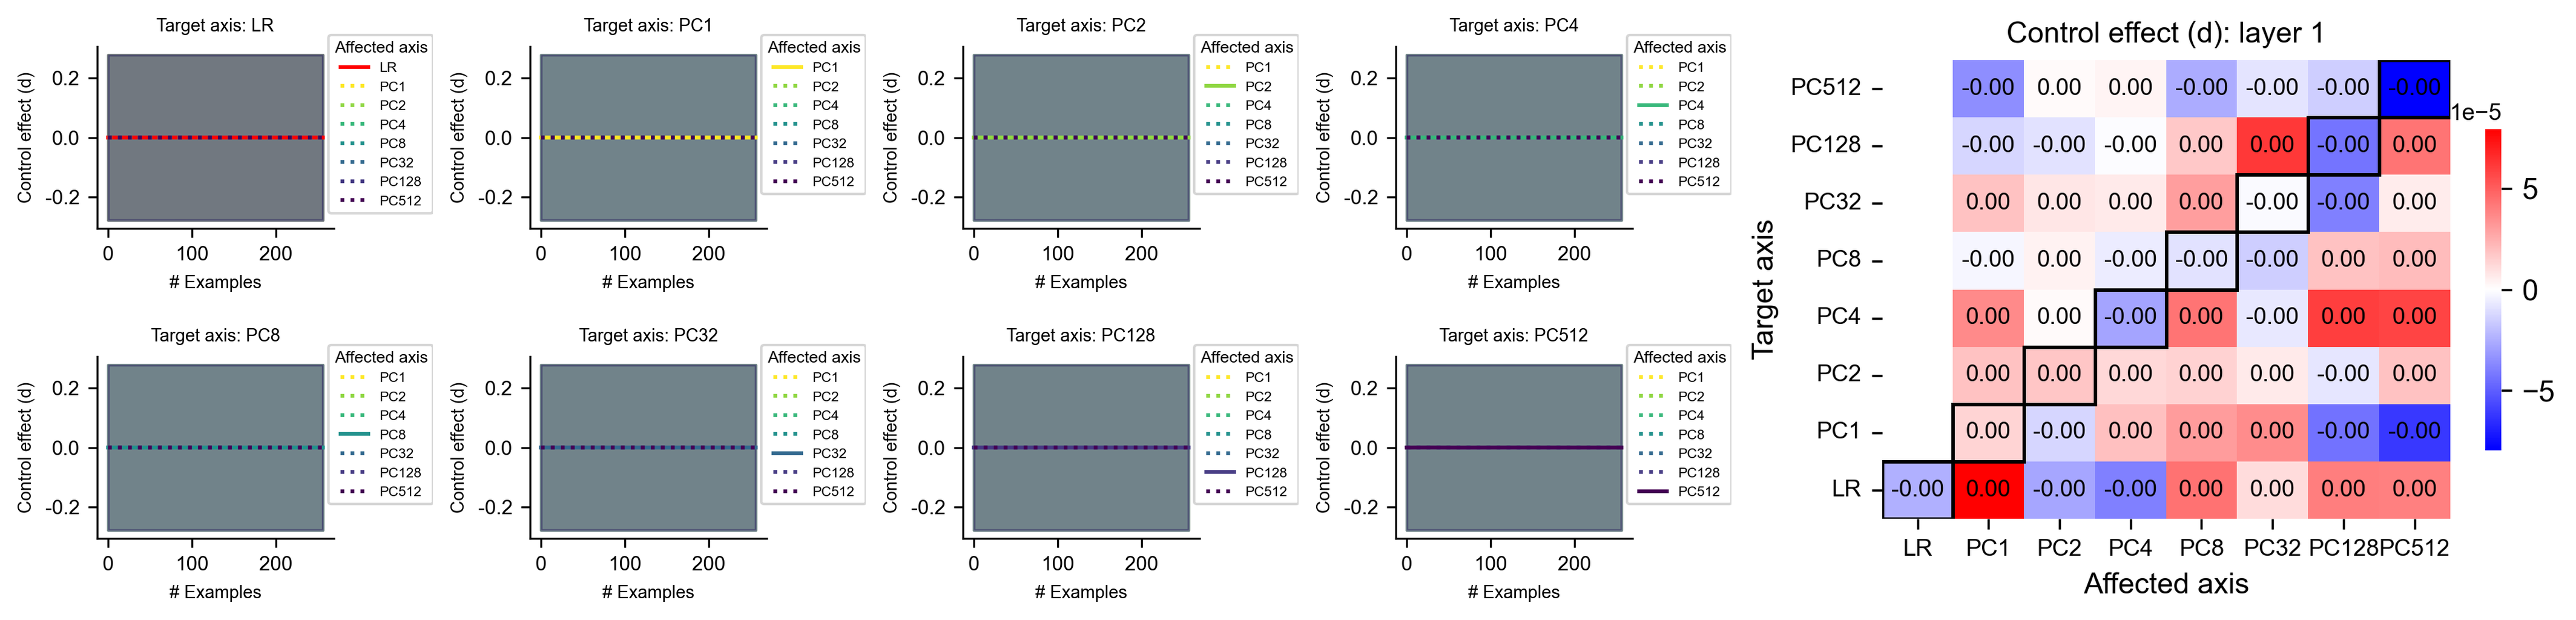
Eight line charts depict control effect (d) across different target axes. Each chart includes:
- **X-axis**: Number of examples (0–200)
- **Y-axis**: Control effect (d) ranging from -0.2 to 0.2
- **Legend**: Colored lines representing affected axes
### Chart Details:
1. **Target Axis: LR**
- Affected axes: LR (red solid line)
- Other axes: PC1–PC512 (dotted lines, no visible deviation)
2. **Target Axis: PC1**
- Affected axes: PC1 (yellow dashed line)
- Other axes: PC2–PC512 (dotted lines, no visible deviation)
3. **Target Axis: PC2**
- Affected axes: PC2 (green dashed line)
- Other axes: PC1, PC3–PC512 (dotted lines, no visible deviation)
4. **Target Axis: PC4**
- Affected axes: PC4 (cyan dashed line)
- Other axes: PC1–PC3, PC5–PC512 (dotted lines, no visible deviation)
5. **Target Axis: PC8**
- Affected axes: PC8 (teal dashed line)
- Other axes: PC1–PC7, PC9–PC512 (dotted lines, no visible deviation)
6. **Target Axis: PC32**
- Affected axes: PC32 (dark blue dashed line)
- Other axes: PC1–PC31, PC33–PC512 (dotted lines, no visible deviation)
7. **Target Axis: PC128**
- Affected axes: PC128 (purple dashed line)
- Other axes: PC1–PC127, PC129–PC512 (dotted lines, no visible deviation)
8. **Target Axis: PC512**
- Affected axes: PC512 (dark purple dashed line)
- Other axes: PC1–PC511 (dotted lines, no visible deviation)
## Heatmap (Right Section)
**Title**: Control effect (d): layer 1
**Color Scale**: -5 (blue) to 5 (red)
**Axes**:
- **Rows (Target Axes)**: LR, PC1, PC2, PC4, PC8, PC32, PC128, PC512
- **Columns (Affected Axes)**: PC1, PC2, PC4, PC8, PC32, PC128, PC512, LR
### Heatmap Data Table:
| Target\Affected | PC1 | PC2 | PC4 | PC8 | PC32 | PC128 | PC512 | LR |
|-----------------|-----------|-----------|-----------|-----------|-----------|-----------|-----------|-----------|
| **LR** | -0.00 | 0.00 | 0.00 | 0.00 | 0.00 | 0.00 | 0.00 | -0.00 |
| **PC1** | 0.00 | 0.00 | 0.00 | 0.00 | 0.00 | 0.00 | 0.00 | 0.00 |
| **PC2** | 0.00 | 0.00 | 0.00 | 0.00 | 0.00 | 0.00 | 0.00 | 0.00 |
| **PC4** | 0.00 | 0.00 | 0.00 | 0.00 | 0.00 | 0.00 | 0.00 | 0.00 |
| **PC8** | 0.00 | 0.00 | 0.00 | 0.00 | 0.00 | 0.00 | 0.00 | 0.00 |
| **PC32** | 0.00 | 0.00 | 0.00 | 0.00 | 0.00 | 0.00 | 0.00 | 0.00 |
| **PC128** | 0.00 | 0.00 | 0.00 | 0.00 | 0.00 | 0.00 | 0.00 | 0.00 |
| **PC512** | 0.00 | 0.00 | 0.00 | 0.00 | 0.00 | 0.00 | 0.00 | 0.00 |
### Key Observations:
- **Highlighted Values**:
- PC512 (LR): -0.00 (blue)
- PC1 (PC512): 0.00 (red)
- PC512 (PC1): 0.00 (red)
- **Color Coding**:
- Blue cells: Negative control effects (e.g., -0.00)
- Red cells: Positive control effects (e.g., 0.00)
- White cells: Neutral/zero control effects
## Cross-Referenced Legend Consistency
- **Line Charts**: Legend colors match heatmap column colors (e.g., PC1 = yellow in line charts, PC1 = column header in heatmap).
- **Affected Axes**: Dotted lines in line charts correspond to non-highlighted axes in heatmap rows/columns.
## Summary
- Line charts show minimal control effect deviations (all lines flat at 0).
- Heatmap reveals sparse control effects, with most cells at 0.00 and isolated non-zero values (e.g., PC512-LR interaction).