## Line Chart: Hits@10 Values (%) vs. Training Epochs
### Overview
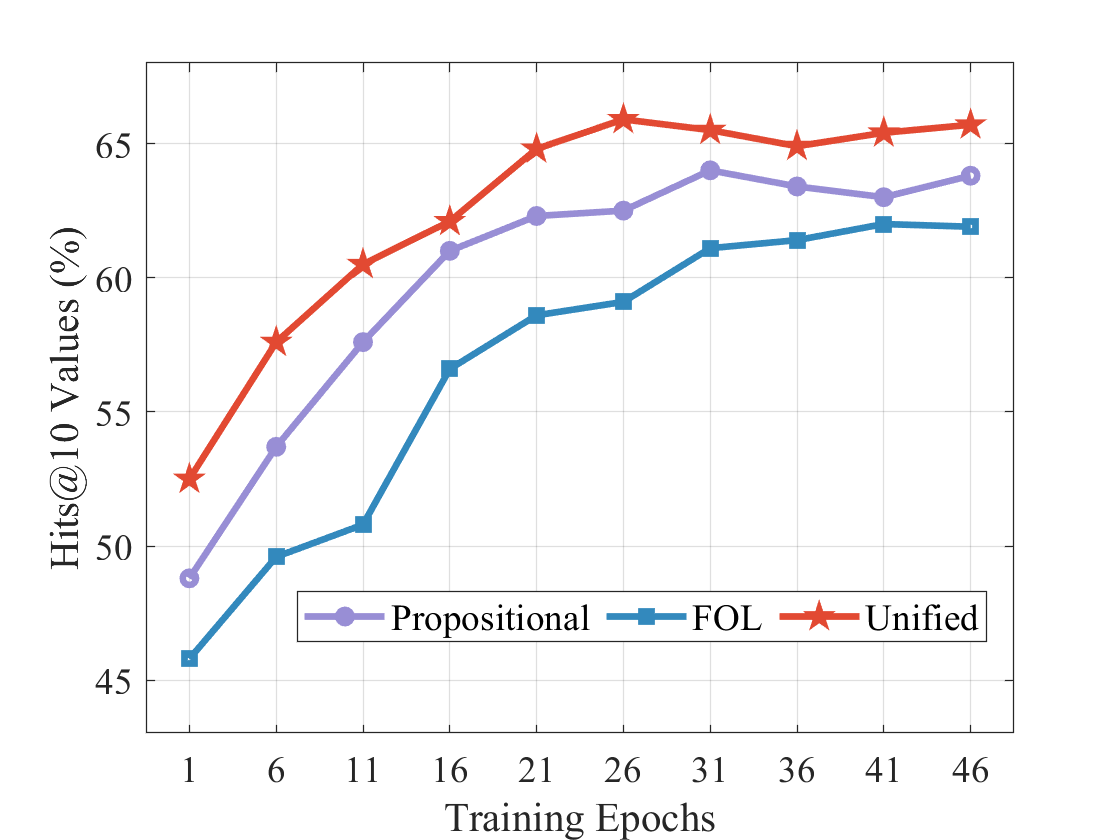
The image is a line chart comparing the performance of three different models ("Propositional", "FOL", and "Unified") over a range of training epochs. The y-axis represents "Hits@10 Values (%)", indicating the percentage of correct predictions within the top 10 results. The x-axis represents "Training Epochs", showing the progression of training.
### Components/Axes
* **Title:** Hits@10 Values (%) vs. Training Epochs (inferred)
* **X-axis:**
* Label: Training Epochs
* Scale: 1, 6, 11, 16, 21, 26, 31, 36, 41, 46
* **Y-axis:**
* Label: Hits@10 Values (%)
* Scale: 45, 50, 55, 60, 65
* **Legend:** Located at the bottom-center of the chart.
* Propositional (light purple line with circle markers)
* FOL (blue line with square markers)
* Unified (red line with star markers)
### Detailed Analysis
* **Propositional (light purple line with circle markers):**
* Trend: Generally increasing, with a slight plateau towards the end.
* Data Points:
* Epoch 1: ~48.5%
* Epoch 6: ~53.5%
* Epoch 11: ~57.5%
* Epoch 16: ~61.5%
* Epoch 21: ~62.5%
* Epoch 26: ~62.5%
* Epoch 31: ~64%
* Epoch 36: ~63.5%
* Epoch 41: ~63%
* Epoch 46: ~64%
* **FOL (blue line with square markers):**
* Trend: Increasing, with a plateau after epoch 31.
* Data Points:
* Epoch 1: ~46%
* Epoch 6: ~49.5%
* Epoch 11: ~51%
* Epoch 16: ~56.5%
* Epoch 21: ~58.5%
* Epoch 26: ~59%
* Epoch 31: ~61%
* Epoch 36: ~61.5%
* Epoch 41: ~62%
* Epoch 46: ~62%
* **Unified (red line with star markers):**
* Trend: Increasing sharply initially, then plateaus and slightly decreases.
* Data Points:
* Epoch 1: ~52.5%
* Epoch 6: ~57.5%
* Epoch 11: ~60.5%
* Epoch 16: ~62%
* Epoch 21: ~65%
* Epoch 26: ~66%
* Epoch 31: ~65.5%
* Epoch 36: ~65%
* Epoch 41: ~65.5%
* Epoch 46: ~66%
### Key Observations
* The "Unified" model initially performs the best, showing the most rapid increase in Hits@10 values.
* The "FOL" model shows the slowest initial increase but continues to improve over the training epochs.
* All three models plateau in performance after approximately 30 epochs.
### Interpretation
The chart demonstrates the learning curves of three different models during training. The "Unified" model appears to have the best initial learning rate, but its performance plateaus relatively early. The "FOL" model, while starting slower, shows a more consistent improvement over a longer period. The "Propositional" model falls in between. The plateauing of all models suggests that further training beyond 30 epochs may not significantly improve their performance, and other optimization strategies might be needed. The data suggests that the "Unified" model is a good starting point, but the "FOL" model might eventually catch up with more training.