\n
## Line Chart: Hits@10 Values vs. Training Epochs
### Overview
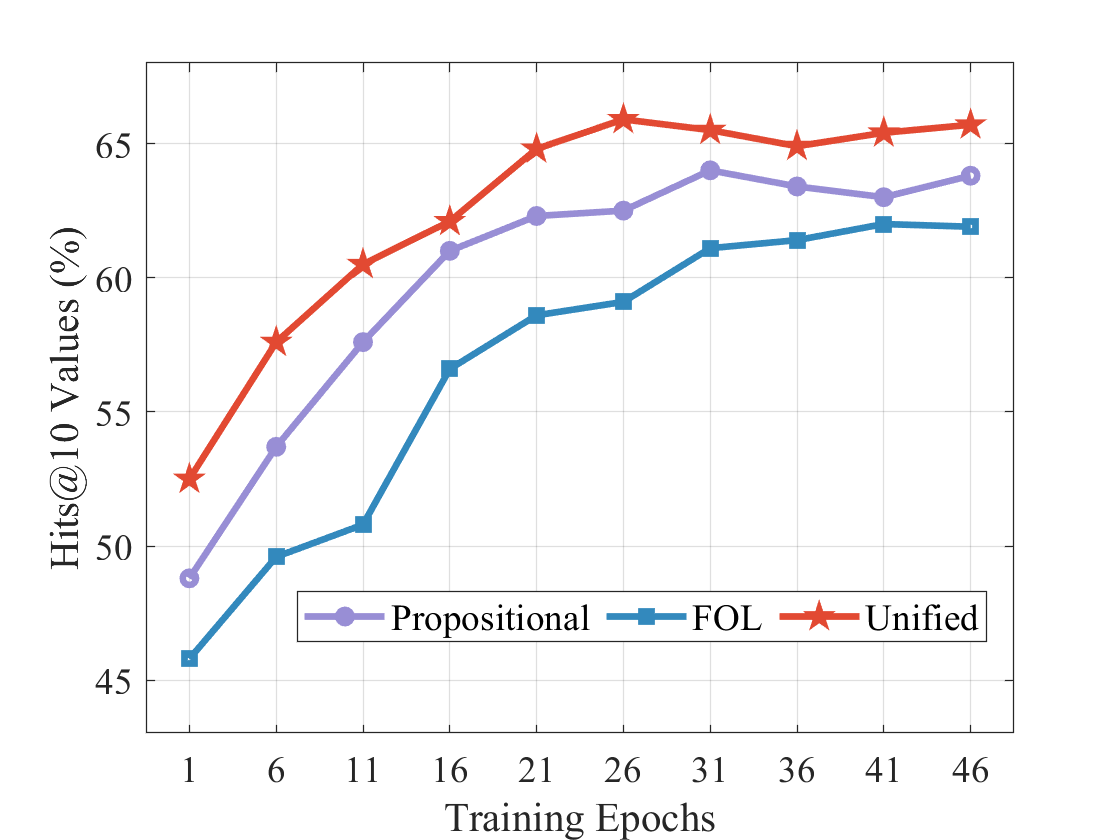
This line chart depicts the performance of three different models – Propositional, FOL (First-Order Logic), and Unified – over 46 training epochs. The performance metric is "Hits@10 Values (%)", representing the percentage of times the correct answer appears within the top 10 predicted values.
### Components/Axes
* **X-axis:** Training Epochs, ranging from 1 to 46, with markers at intervals of 5.
* **Y-axis:** Hits@10 Values (%), ranging from 45% to 65%, with markers at intervals of 5.
* **Legend:** Located at the bottom-center of the chart, identifying the three data series:
* Propositional (represented by a light blue line with circle markers)
* FOL (represented by a dark blue line with square markers)
* Unified (represented by a red line with star markers)
* **Gridlines:** A light gray grid is present to aid in reading values.
### Detailed Analysis
Let's analyze each line individually:
* **Propositional (Light Blue):** The line starts at approximately 49% at epoch 1. It shows a steep upward trend until around epoch 16, reaching approximately 62%. After epoch 16, the growth slows down, and the line plateaus, fluctuating between 62% and 64% for the remaining epochs, ending at approximately 63% at epoch 46.
* **FOL (Dark Blue):** This line exhibits the most rapid initial growth. Starting at approximately 47% at epoch 1, it increases sharply until epoch 16, reaching approximately 58%. The growth continues, but at a slower rate, reaching approximately 62% at epoch 26. From epoch 26 to 46, the line shows minimal improvement, stabilizing around 62-63%, ending at approximately 62% at epoch 46.
* **Unified (Red):** The Unified model demonstrates the highest overall performance. Starting at approximately 57% at epoch 1, it increases steadily until epoch 16, reaching approximately 63%. The line continues to rise, reaching a peak of approximately 65% around epoch 21. After epoch 21, the line fluctuates between 64% and 65%, ending at approximately 65% at epoch 46.
Here's a table summarizing approximate values at key epochs:
| Epoch | Propositional (%) | FOL (%) | Unified (%) |
|-------|-------------------|---------|-------------|
| 1 | 49 | 47 | 57 |
| 6 | 52 | 50 | 58 |
| 11 | 56 | 53 | 60 |
| 16 | 62 | 58 | 63 |
| 21 | 62 | 60 | 65 |
| 26 | 62 | 62 | 64 |
| 31 | 63 | 62 | 64 |
| 36 | 63 | 62 | 64 |
| 41 | 63 | 62 | 65 |
| 46 | 63 | 62 | 65 |
### Key Observations
* The Unified model consistently outperforms both the Propositional and FOL models across all training epochs.
* The FOL model shows the fastest initial learning rate, but its performance plateaus earlier than the other two models.
* The Propositional model exhibits a more gradual learning curve and reaches a plateau similar to the FOL model.
* All three models demonstrate diminishing returns in performance as training progresses beyond 20 epochs.
### Interpretation
The chart suggests that the Unified model is the most effective approach for this task, achieving the highest Hits@10 values. The initial rapid learning of the FOL model might indicate its ability to quickly capture fundamental relationships, but its limited capacity prevents it from achieving the same level of performance as the Unified model in the long run. The Propositional model, while showing steady improvement, lags behind both the FOL and Unified models, suggesting its limitations in representing complex relationships. The plateauing of all three models indicates that further training beyond a certain point yields minimal performance gains, suggesting that the models have converged or that the dataset has been sufficiently learned. The diminishing returns observed after epoch 20 could also indicate the need for a more complex model or a larger, more diverse dataset.