# Technical Diagram Analysis: Cloud System Monitoring and Self-Healing Workflow
## Diagram Structure
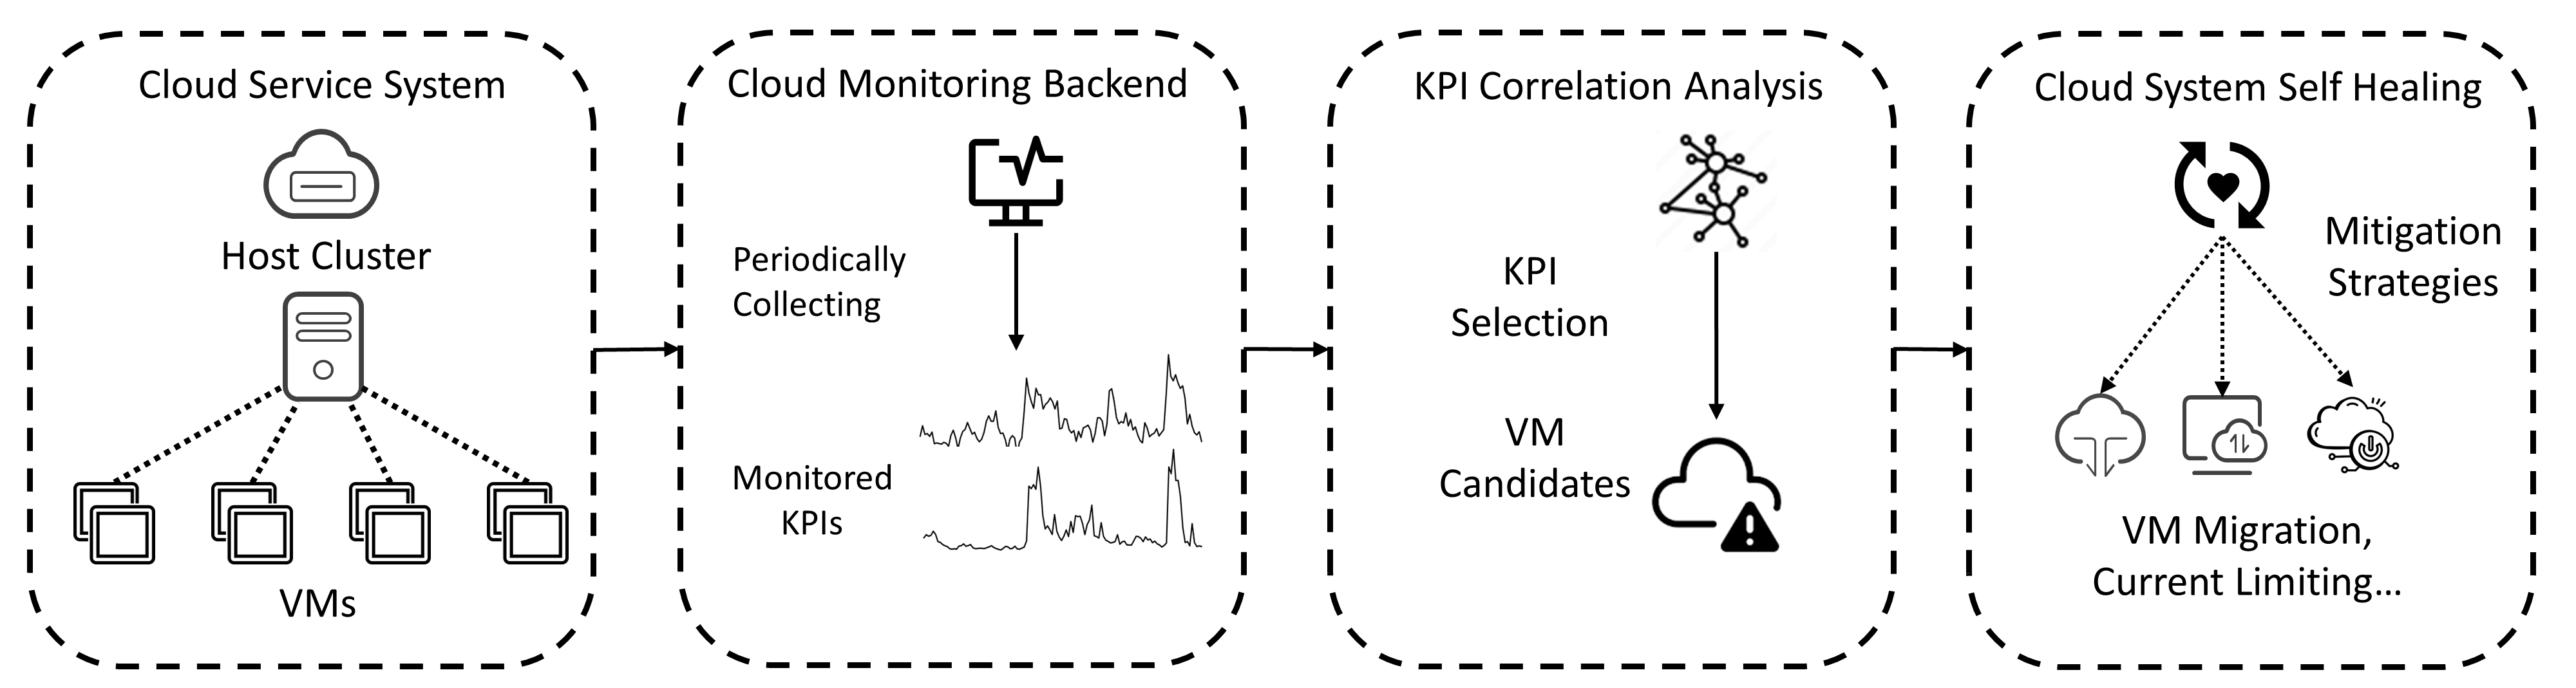
The diagram illustrates a four-stage workflow for cloud system monitoring and automated mitigation. Each stage is enclosed in a dashed-line box with directional arrows indicating process flow.
---
### 1. Cloud Service System
**Components:**
- **Host Cluster** (Server icon)
- Connected via dotted lines to:
- **VMs** (Four stacked square icons)
- Representation of virtual machines
**Key Elements:**
- Cloud Service System (Top label)
- Host Cluster (Central server icon)
- VMs (Bottom tier of virtual machine icons)
---
### 2. Cloud Monitoring Backend
**Process Flow:**
- **Input:** Monitored KPIs (Line graph visualization)
- **Output:** Periodically Collecting (Arrow to next stage)
**Key Elements:**
- Cloud Monitoring Backend (Top label)
- Periodically Collecting (Process description)
- Monitored KPIs (Graph visualization with two waveform lines)
---
### 3. KPI Correlation Analysis
**Process Flow:**
- **Input:** KPI Selection (Network graph visualization)
- **Output:** VM Candidates (Cloud icon with warning triangle)
**Key Elements:**
- KPI Correlation Analysis (Top label)
- KPI Selection (Network graph with interconnected nodes)
- VM Candidates (Cloud icon with exclamation mark)
---
### 4. Cloud System Self Healing
**Mitigation Strategies:**
1. **VM Migration** (Cloud icon with downward arrow)
2. **Current Limiting** (Cloud icon with power button)
3. **Mitigation Strategies** (Top label)
**Key Elements:**
- Cloud System Self Healing (Top label)
- Heart-shaped recycling symbol (Central mitigation trigger)
- Three mitigation strategy icons with connecting arrows
---
### Workflow Connections
1. Cloud Service System → Cloud Monitoring Backend
2. Cloud Monitoring Backend → KPI Correlation Analysis
3. KPI Correlation Analysis → Cloud System Self Healing
---
### Visual Elements Summary
- **Icons Used:**
- Server (Host Cluster)
- Stacked squares (VMs)
- Line graphs (KPIs)
- Network graph (KPI Selection)
- Cloud with warning (VM Candidates)
- Recycling symbol (Self Healing trigger)
- Cloud with arrow/power button (Mitigation strategies)
- **Color Coding:**
- All elements in black/white (no color differentiation)
- Warning triangle in KPI Candidates section
- **Textual Descriptions:**
- All process stages labeled with uppercase titles
- Technical terms in title case (e.g., "KPI Correlation Analysis")
- Mitigation strategies listed with technical implementations
---
### Process Flow Interpretation
1. **Monitoring Phase:** Host cluster VMs generate monitored KPIs
2. **Analysis Phase:** KPIs are periodically collected and analyzed for correlations
3. **Action Phase:** Critical VM candidates trigger self-healing mechanisms
4. **Mitigation Phase:** Automated strategies (migration, current limiting) are executed
This diagram represents an automated cloud infrastructure management system with real-time monitoring, predictive analysis, and autonomous remediation capabilities.