TECHNICAL ASSET FINGERPRINT
350e42153ffb47c4285c3fd7
Click to view fullscreen
Press ESC or click to close
FOUND IN PAPERS
EXPERT: gemini-2.0-flash VERSION 1
RUNTIME: nugit/gemini/gemini-2.0-flash
INTEL_VERIFIED
## Scatter Plot with Error Bars: Risk Attitude and Lottery Choice
### Overview
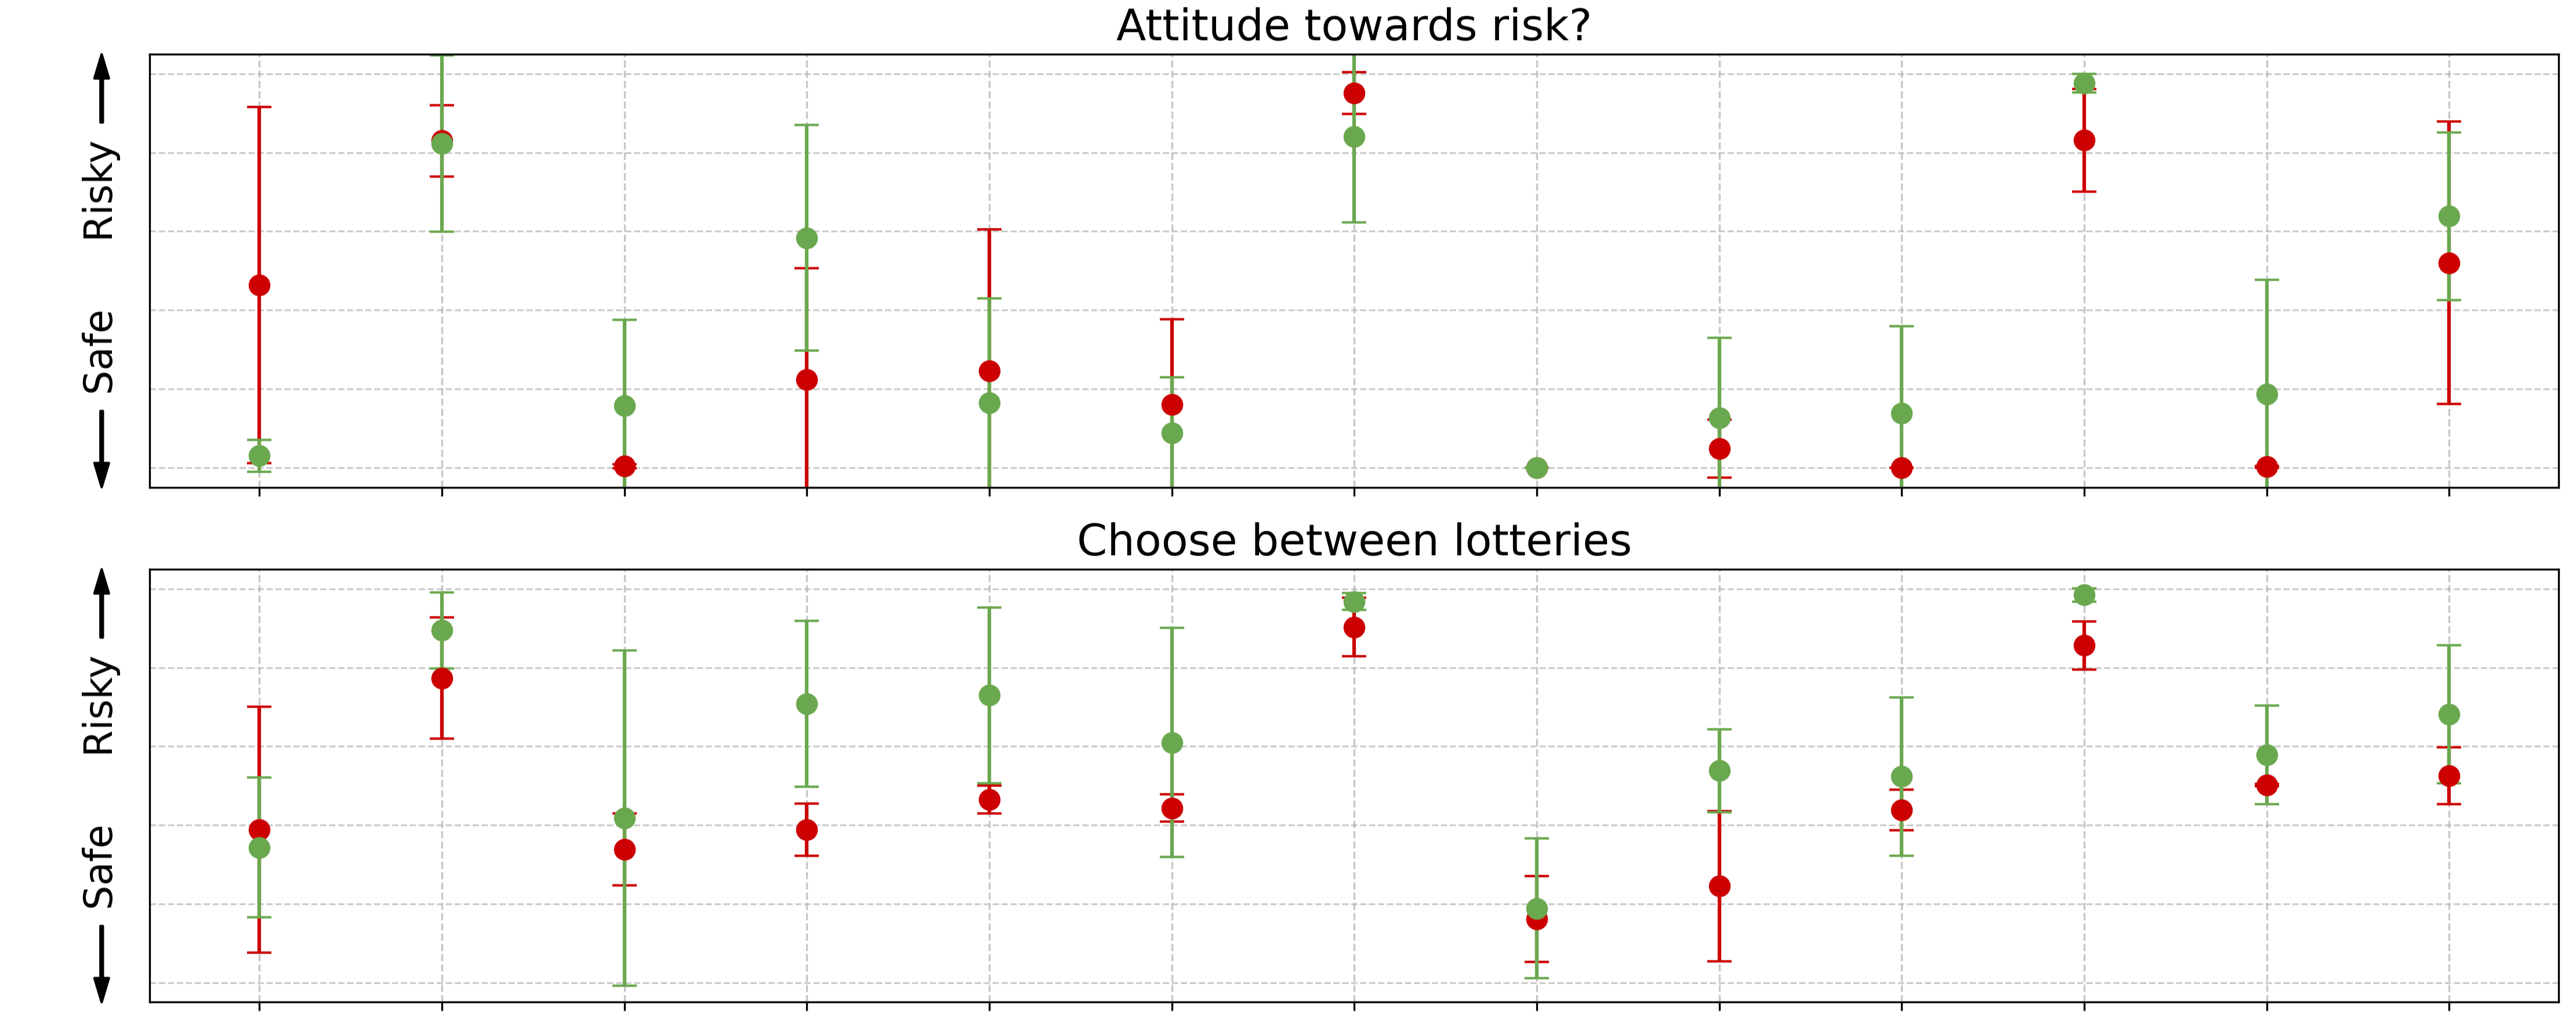
The image presents two scatter plots, each displaying data points with error bars. The top plot is titled "Attitude towards risk?" and the bottom plot is titled "Choose between lotteries". Both plots share a common vertical axis labeled "Safe" to "Risky" with an arrow indicating the direction of increasing risk. The horizontal axis is unlabeled and represents different scenarios or conditions. Each data point is represented by a circle, with green circles and red circles indicating different groups or conditions. Error bars extend vertically from each data point, indicating the uncertainty or variability associated with each data point.
### Components/Axes
* **Titles:**
* Top Plot: "Attitude towards risk?"
* Bottom Plot: "Choose between lotteries"
* **Vertical Axis:**
* Label: "Safe" to "Risky" with an arrow pointing upwards towards "Risky".
* Scale: Qualitative, representing a spectrum from safe to risky.
* **Horizontal Axis:**
* No explicit label. Represents different scenarios or conditions.
* **Data Points:**
* Green circles: Represent one group or condition.
* Red circles: Represent another group or condition.
* **Error Bars:**
* Vertical lines extending from each data point, indicating variability or uncertainty.
### Detailed Analysis or ### Content Details
**Top Plot: Attitude towards risk?**
* **Data Point 1:**
* Green circle: Located near the "Safe" end of the vertical axis. Approximate value: 0.15 on a scale of 0 to 1 where 0 is "Safe" and 1 is "Risky". Error bar extends upwards to approximately 0.3.
* Red circle: Located higher on the vertical axis. Approximate value: 0.6. Error bar extends from approximately 0.4 to 0.8.
* **Data Point 2:**
* Green circle: Located near the "Risky" end of the vertical axis. Approximate value: 0.85. Error bar extends from approximately 0.7 to 1.
* Red circle: Not present.
* **Data Point 3:**
* Green circle: Located near the "Safe" end of the vertical axis. Approximate value: 0.1. Error bar extends from approximately 0 to 0.3.
* Red circle: Located higher on the vertical axis. Approximate value: 0.5. Error bar extends from approximately 0.3 to 0.7.
* **Data Point 4:**
* Green circle: Located approximately in the middle of the vertical axis. Approximate value: 0.5. Error bar extends from approximately 0.3 to 0.7.
* Red circle: Located slightly higher on the vertical axis. Approximate value: 0.6. Error bar extends from approximately 0.4 to 0.8.
* **Data Point 5:**
* Green circle: Located near the "Risky" end of the vertical axis. Approximate value: 0.95. Error bar extends from approximately 0.8 to 1.
* Red circle: Not present.
* **Data Point 6:**
* Green circle: Located near the "Safe" end of the vertical axis. Approximate value: 0.05. Error bar extends from approximately 0 to 0.2.
* Red circle: Not present.
* **Data Point 7:**
* Green circle: Located approximately in the middle of the vertical axis. Approximate value: 0.4. Error bar extends from approximately 0.2 to 0.6.
* Red circle: Located near the "Safe" end of the vertical axis. Approximate value: 0.2. Error bar extends from approximately 0 to 0.4.
* **Data Point 8:**
* Green circle: Located approximately in the middle of the vertical axis. Approximate value: 0.4. Error bar extends from approximately 0.2 to 0.6.
* Red circle: Located near the "Safe" end of the vertical axis. Approximate value: 0.2. Error bar extends from approximately 0 to 0.4.
* **Data Point 9:**
* Green circle: Located near the "Risky" end of the vertical axis. Approximate value: 0.9. Error bar extends from approximately 0.7 to 1.
* Red circle: Not present.
* **Data Point 10:**
* Green circle: Located approximately in the middle of the vertical axis. Approximate value: 0.4. Error bar extends from approximately 0.2 to 0.6.
* Red circle: Located near the "Risky" end of the vertical axis. Approximate value: 0.7. Error bar extends from approximately 0.5 to 0.9.
**Bottom Plot: Choose between lotteries**
* **Data Point 1:**
* Green circle: Located near the "Safe" end of the vertical axis. Approximate value: 0.2. Error bar extends from approximately 0 to 0.4.
* Red circle: Located approximately in the middle of the vertical axis. Approximate value: 0.5. Error bar extends from approximately 0.3 to 0.7.
* **Data Point 2:**
* Green circle: Located near the "Risky" end of the vertical axis. Approximate value: 0.8. Error bar extends from approximately 0.6 to 1.
* Red circle: Located approximately in the middle of the vertical axis. Approximate value: 0.6. Error bar extends from approximately 0.4 to 0.8.
* **Data Point 3:**
* Green circle: Located approximately in the middle of the vertical axis. Approximate value: 0.6. Error bar extends from approximately 0.4 to 0.8.
* Red circle: Located near the "Safe" end of the vertical axis. Approximate value: 0.2. Error bar extends from approximately 0 to 0.4.
* **Data Point 4:**
* Green circle: Located approximately in the middle of the vertical axis. Approximate value: 0.5. Error bar extends from approximately 0.3 to 0.7.
* Red circle: Located near the "Safe" end of the vertical axis. Approximate value: 0.3. Error bar extends from approximately 0.1 to 0.5.
* **Data Point 5:**
* Green circle: Located near the "Risky" end of the vertical axis. Approximate value: 0.9. Error bar extends from approximately 0.7 to 1.
* Red circle: Not present.
* **Data Point 6:**
* Green circle: Located near the "Safe" end of the vertical axis. Approximate value: 0.1. Error bar extends from approximately 0 to 0.3.
* Red circle: Located near the "Safe" end of the vertical axis. Approximate value: 0.2. Error bar extends from approximately 0 to 0.4.
* **Data Point 7:**
* Green circle: Located near the "Safe" end of the vertical axis. Approximate value: 0.3. Error bar extends from approximately 0.1 to 0.5.
* Red circle: Located near the "Safe" end of the vertical axis. Approximate value: 0.1. Error bar extends from approximately 0 to 0.3.
* **Data Point 8:**
* Green circle: Located near the "Safe" end of the vertical axis. Approximate value: 0.3. Error bar extends from approximately 0.1 to 0.5.
* Red circle: Located near the "Risky" end of the vertical axis. Approximate value: 0.8. Error bar extends from approximately 0.6 to 1.
* **Data Point 9:**
* Green circle: Located near the "Safe" end of the vertical axis. Approximate value: 0.4. Error bar extends from approximately 0.2 to 0.6.
* Red circle: Located near the "Safe" end of the vertical axis. Approximate value: 0.3. Error bar extends from approximately 0.1 to 0.5.
* **Data Point 10:**
* Green circle: Located approximately in the middle of the vertical axis. Approximate value: 0.7. Error bar extends from approximately 0.5 to 0.9.
* Red circle: Located near the "Safe" end of the vertical axis. Approximate value: 0.4. Error bar extends from approximately 0.2 to 0.6.
### Key Observations
* The green and red data points often show opposing trends, with one being closer to "Safe" while the other is closer to "Risky".
* The error bars indicate a significant degree of variability or uncertainty in the data.
* In the top plot, there are instances where only a green data point is present.
* The horizontal axis is not labeled, making it difficult to interpret the specific conditions or scenarios being compared.
### Interpretation
The plots compare two different groups (represented by green and red circles) across various scenarios (represented by the unlabeled horizontal axis) in terms of their attitude towards risk and their choices between lotteries. The error bars suggest that the observed differences may not always be statistically significant. The unlabeled horizontal axis limits the interpretability of the results, as the specific conditions being compared are unknown. The data suggests that there are differences in risk preferences between the two groups, but further information is needed to understand the context and significance of these differences.
DECODING INTELLIGENCE...