## Diagram: Source-Process Interaction Flowchart
### Overview
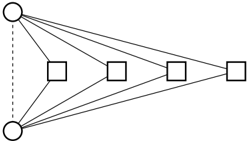
The diagram illustrates a bidirectional relationship between two source nodes ("Source A" and "Source B") and four process nodes ("Process 1" to "Process 4"). Solid lines connect the sources to all processes, while dashed bidirectional lines link the two sources.
### Components/Axes
- **Nodes**:
- **Source A** (top-left circle)
- **Source B** (bottom-left circle)
- **Process 1** (first square from left)
- **Process 2** (second square from left)
- **Process 3** (third square from left)
- **Process 4** (rightmost square)
- **Connections**:
- Solid lines: From **Source A** and **Source B** to all four processes.
- Dashed bidirectional lines: Between **Source A** and **Source B**.
### Detailed Analysis
- **Source-Process Relationships**:
- Each process node receives input from both **Source A** and **Source B** via solid lines.
- No process node is isolated; all are directly connected to both sources.
- **Source-Source Relationship**:
- Dashed bidirectional lines between **Source A** and **Source B** suggest mutual influence or shared dependencies.
### Key Observations
1. **Centralized Flow**: All processes depend equally on both sources, indicating no preferential input.
2. **Bidirectional Source Interaction**: The dashed lines imply a feedback loop or collaborative relationship between the sources.
3. **Uniform Connectivity**: Processes 1–4 exhibit identical connection patterns to the sources, suggesting homogeneity in their dependencies.
### Interpretation
This diagram likely represents a system where two independent sources (e.g., data inputs, departments, or entities) contribute to four distinct processes. The bidirectional relationship between the sources highlights interdependence, while the uniform solid lines to processes emphasize that all processes integrate inputs from both sources. The absence of intermediate nodes or branching paths suggests a direct, unmediated flow from sources to processes.
**Notable Patterns**:
- Symmetry in source-process connections.
- Lack of hierarchical or sequential relationships among processes.
- Equal weighting of inputs from **Source A** and **Source B** for all processes.
**Underlying Implications**:
- The system may prioritize redundancy or fault tolerance, as processes rely on both sources.
- The bidirectional source interaction could indicate shared resources, mutual validation, or collaborative workflows.
- Processes 1–4 may represent stages or components of a larger system requiring dual-source inputs.