\n
## Diagram: Network/Flow Representation
### Overview
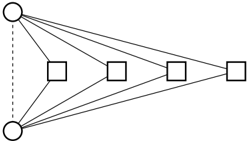
The image depicts a diagram representing a network or flow between two sets of nodes. There are two circular nodes on the left and four square nodes on the right, connected by multiple lines. The diagram appears to illustrate a many-to-many relationship or a divergent flow.
### Components/Axes
The diagram consists of:
* **Circular Nodes (Input/Source):** Two circular nodes positioned on the left side of the diagram.
* **Square Nodes (Output/Destination):** Four square nodes positioned on the right side of the diagram.
* **Connecting Lines:** Lines connecting each circular node to each square node.
* **Dashed Line:** A dashed vertical line connecting the two circular nodes.
There are no axis titles, legends, or numerical values present in the image.
### Detailed Analysis or Content Details
The diagram shows a complete connection between the two circular nodes and the four square nodes. Each circular node is connected to each of the four square nodes via a straight line. The dashed line between the two circular nodes suggests a relationship or dependency between them.
Specifically:
* Circular Node 1 connects to Square Node 1, Square Node 2, Square Node 3, and Square Node 4.
* Circular Node 2 connects to Square Node 1, Square Node 2, Square Node 3, and Square Node 4.
### Key Observations
The diagram demonstrates a fully connected network where each input node influences all output nodes. The dashed line suggests a potential correlation or shared characteristic between the two input nodes. The absence of any labels or values makes it difficult to determine the nature of the relationship or the significance of the connections.
### Interpretation
The diagram likely represents a system where two sources (circular nodes) contribute to four outcomes (square nodes). The complete connectivity suggests that both sources have an impact on all outcomes. The dashed line could indicate that the two sources are related or operate in tandem. Without further context, it's difficult to determine the specific meaning of the diagram. It could represent a decision-making process, a data flow, or a network of relationships. The diagram is abstract and relies on the viewer to interpret the meaning based on the context in which it is presented. It is a visual representation of a many-to-many mapping.