\n
## Charts: Learning Dynamics under Different Training Protocols
### Overview
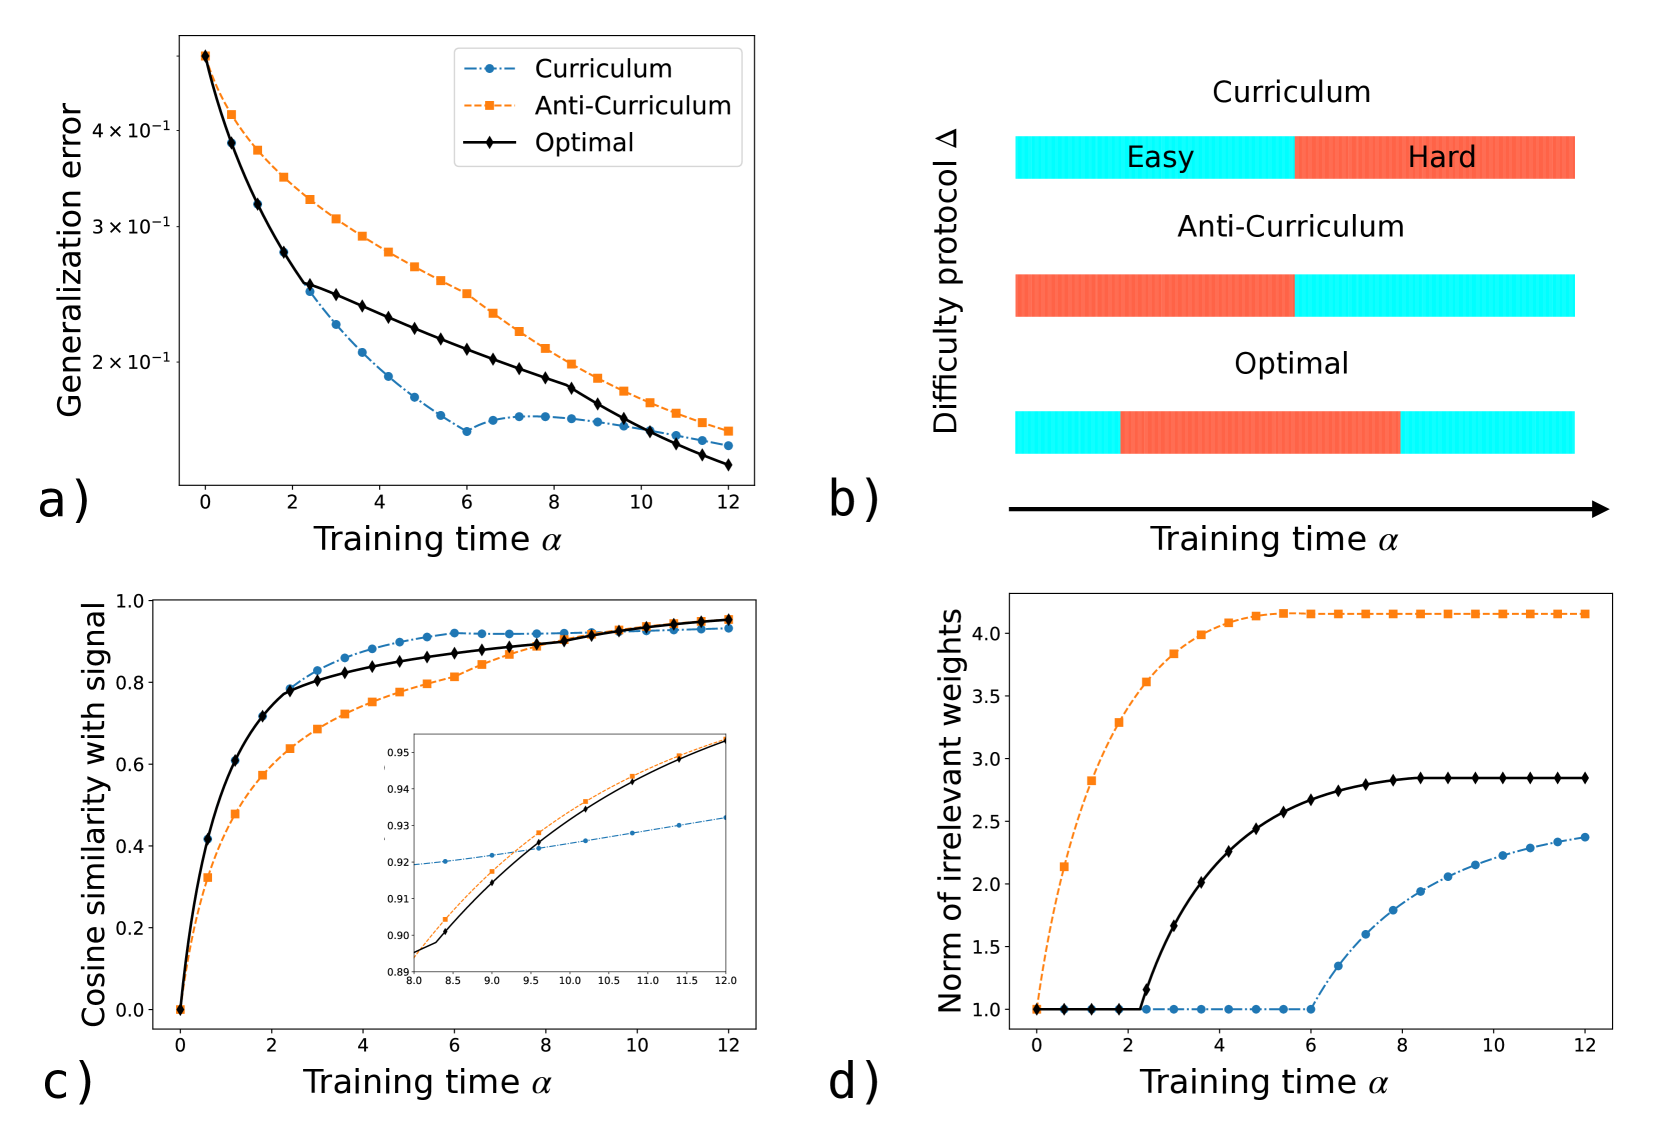
The image presents four charts (a, b, c, and d) illustrating the performance of three different training protocols – Curriculum, Anti-Curriculum, and Optimal – across various metrics as a function of training time (α). The charts compare generalization error, difficulty protocol, cosine similarity with signal, and norm of irrelevant weights.
### Components/Axes
* **Chart a:**
* X-axis: Training time α (0 to 12)
* Y-axis: Generalization error (logarithmic scale, from approximately 1x10^-1 to 4x10^-1)
* Legend:
* Curriculum (dashed blue line)
* Anti-Curriculum (dashed orange line)
* Optimal (solid black line)
* **Chart b:**
* X-axis: Training time α (0 to 12)
* Y-axis: Difficulty protocol Δ (no units)
* Legend:
* Curriculum (light blue) - labeled "Easy" to "Hard"
* Anti-Curriculum (light orange) - labeled "Easy" to "Hard"
* Optimal (light green) - labeled "Easy" to "Hard"
* **Chart c:**
* X-axis: Training time α (0 to 12)
* Y-axis: Cosine similarity with signal (0 to 1)
* Legend:
* Curriculum (dashed blue line)
* Anti-Curriculum (dashed orange line)
* Optimal (solid black line)
* Inset Chart: A zoomed-in view of the Anti-Curriculum line between α = 4 and α = 6, showing values between approximately 0.88 and 0.96.
* **Chart d:**
* X-axis: Training time α (0 to 12)
* Y-axis: Norm of irrelevant weights (approximately 1 to 4)
* Legend:
* Curriculum (dashed blue line)
* Anti-Curriculum (dashed orange line)
* Optimal (solid black line)
### Detailed Analysis or Content Details
* **Chart a (Generalization Error):**
* Optimal (black): Starts at approximately 0.35 and decreases rapidly to approximately 0.05 by α = 12.
* Curriculum (blue): Starts at approximately 0.3 and decreases steadily to approximately 0.1 by α = 12.
* Anti-Curriculum (orange): Starts at approximately 0.4 and decreases more slowly, reaching approximately 0.2 by α = 12.
* **Chart b (Difficulty Protocol):**
* All three protocols (Curriculum, Anti-Curriculum, Optimal) show a gradient from "Easy" to "Hard" across training time α. The color intensity is consistent across the range.
* **Chart c (Cosine Similarity with Signal):**
* Optimal (black): Increases rapidly from approximately 0.4 to approximately 0.98 by α = 6, then plateaus.
* Curriculum (blue): Increases steadily from approximately 0.4 to approximately 0.95 by α = 12.
* Anti-Curriculum (orange): Increases slowly from approximately 0.2 to approximately 0.9 by α = 12. The inset chart shows a more detailed view of the Anti-Curriculum line, indicating a gradual increase between α = 4 and α = 6.
* **Chart d (Norm of Irrelevant Weights):**
* Optimal (black): Decreases rapidly from approximately 4 to approximately 2 by α = 6, then plateaus.
* Curriculum (blue): Decreases steadily from approximately 3.5 to approximately 2.5 by α = 12.
* Anti-Curriculum (orange): Decreases slowly from approximately 4 to approximately 3 by α = 12.
### Key Observations
* The "Optimal" protocol consistently outperforms both "Curriculum" and "Anti-Curriculum" in terms of generalization error (Chart a) and cosine similarity (Chart c).
* The "Anti-Curriculum" protocol consistently performs the worst across all metrics.
* The difficulty protocol (Chart b) appears to be consistent across all three training methods, showing a gradual increase in difficulty over time.
* The norm of irrelevant weights (Chart d) decreases for all protocols, but the rate of decrease varies significantly.
### Interpretation
The data suggests that the "Optimal" training protocol is the most effective at learning the signal and minimizing generalization error. This protocol also effectively reduces the norm of irrelevant weights, indicating a more focused learning process. The "Curriculum" protocol provides a moderate improvement over the "Anti-Curriculum" protocol, but it does not achieve the same level of performance as the "Optimal" protocol. The "Anti-Curriculum" protocol appears to hinder learning, resulting in higher generalization error, lower cosine similarity, and a slower reduction in irrelevant weights.
The consistent gradient in difficulty protocol (Chart b) across all methods suggests that the difficulty of the training tasks is being systematically increased over time, but the way in which this difficulty is managed differs significantly between the protocols. The inset chart in (c) highlights the slow progress of the Anti-Curriculum protocol, suggesting it struggles to adapt to increasing task complexity.
The relationship between the charts is clear: a lower generalization error (a) is correlated with a higher cosine similarity with the signal (c) and a lower norm of irrelevant weights (d). This indicates that effective learning involves both capturing the relevant signal and suppressing irrelevant information. The "Optimal" protocol excels at both of these aspects, leading to its superior performance.