\n
## Bar Chart: Entity Frequency by Model
### Overview
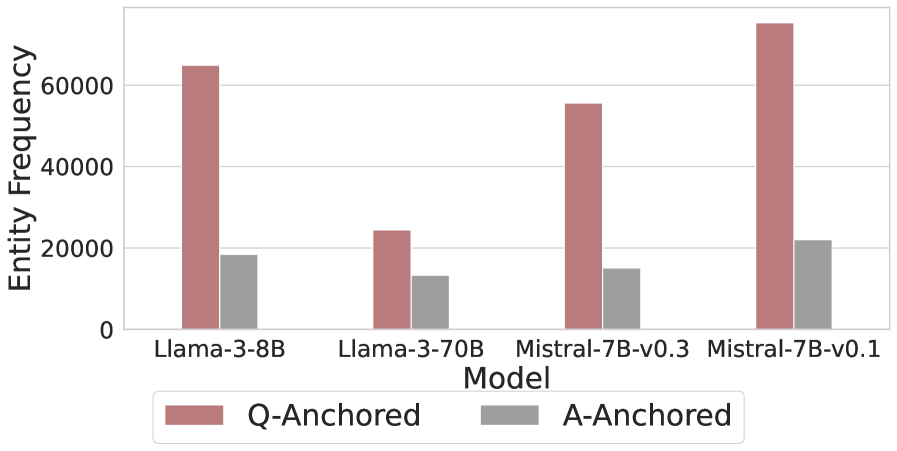
This bar chart compares the entity frequency of two types of anchored entities ("Q-Anchored" and "A-Anchored") across four different language models: Llama-3-8B, Llama-3-70B, Mistral-7B-v0.3, and Mistral-7B-v0.1. The y-axis represents the "Entity Frequency," while the x-axis represents the "Model."
### Components/Axes
* **X-axis:** "Model" with categories: Llama-3-8B, Llama-3-70B, Mistral-7B-v0.3, Mistral-7B-v0.1.
* **Y-axis:** "Entity Frequency" ranging from 0 to 70000, with increments of 10000.
* **Legend:** Located at the bottom-center of the chart.
* "Q-Anchored" - represented by a reddish-brown color.
* "A-Anchored" - represented by a light gray color.
### Detailed Analysis
The chart consists of paired bars for each model, representing Q-Anchored and A-Anchored entity frequencies.
* **Llama-3-8B:**
* Q-Anchored: Approximately 65,000. The bar reaches slightly above the 60,000 mark.
* A-Anchored: Approximately 15,000. The bar reaches slightly above the 10,000 mark.
* **Llama-3-70B:**
* Q-Anchored: Approximately 50,000. The bar reaches slightly below the 50,000 mark.
* A-Anchored: Approximately 20,000. The bar reaches slightly above the 20,000 mark.
* **Mistral-7B-v0.3:**
* Q-Anchored: Approximately 55,000. The bar reaches slightly above the 50,000 mark.
* A-Anchored: Approximately 13,000. The bar reaches slightly above the 10,000 mark.
* **Mistral-7B-v0.1:**
* Q-Anchored: Approximately 70,000. The bar reaches slightly above the 70,000 mark.
* A-Anchored: Approximately 18,000. The bar reaches slightly below the 20,000 mark.
For each model, the Q-Anchored entity frequency is significantly higher than the A-Anchored entity frequency.
### Key Observations
* The highest Q-Anchored entity frequency is observed for Mistral-7B-v0.1 (approximately 70,000).
* The lowest Q-Anchored entity frequency is observed for Llama-3-70B (approximately 50,000).
* The A-Anchored entity frequencies are relatively consistent across all models, ranging from approximately 13,000 to 20,000.
* The difference between Q-Anchored and A-Anchored frequencies is most pronounced for Llama-3-8B.
### Interpretation
The data suggests that Q-Anchored entities are substantially more frequent than A-Anchored entities across all tested language models. This could indicate a bias in the data used to train these models, or a fundamental difference in how these models process or generate these types of entities. The variation in Q-Anchored entity frequency between models (ranging from 50,000 to 70,000) suggests that model architecture or training data significantly impacts the generation or identification of Q-Anchored entities. The relatively stable A-Anchored entity frequency across models might indicate that these entities are more consistently represented or processed by the models. The large difference between the two types of entities for Llama-3-8B could be a unique characteristic of that model, or a result of specific training data characteristics. Further investigation into the nature of Q-Anchored and A-Anchored entities, and the training data used for each model, would be necessary to fully understand these observations.