## Grouped Bar Chart: Entity Frequency by Model and Anchoring Method
### Overview
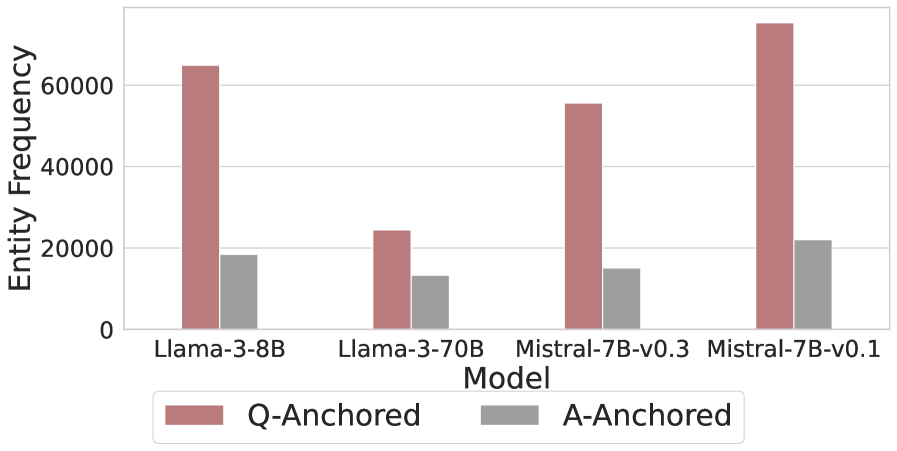
This is a grouped bar chart comparing the "Entity Frequency" for four different large language models, each evaluated under two anchoring conditions: "Q-Anchored" and "A-Anchored". The chart visually demonstrates a consistent and significant difference in entity frequency between the two anchoring methods across all models.
### Components/Axes
* **Chart Type:** Grouped Bar Chart.
* **X-Axis (Horizontal):** Labeled "Model". It lists four distinct models:
1. `Llama-3-8B`
2. `Llama-3-70B`
3. `Mistral-7B-v0.3`
4. `Mistral-7B-v0.1`
* **Y-Axis (Vertical):** Labeled "Entity Frequency". The scale runs from 0 to over 60,000, with major gridlines at intervals of 20,000 (0, 20000, 40000, 60000).
* **Legend:** Positioned at the bottom center of the chart.
* A reddish-brown (terracotta) square corresponds to the label `Q-Anchored`.
* A grey square corresponds to the label `A-Anchored`.
* **Data Series:** For each model on the x-axis, there are two adjacent bars:
* The left bar (reddish-brown) represents the `Q-Anchored` value.
* The right bar (grey) represents the `A-Anchored` value.
### Detailed Analysis
**Trend Verification:** For every model, the `Q-Anchored` bar (reddish-brown, left) is substantially taller than the corresponding `A-Anchored` bar (grey, right). This indicates a consistent trend where the Q-Anchored method yields a much higher entity frequency than the A-Anchored method.
**Approximate Data Points (Spatially Grounded):**
1. **Llama-3-8B:**
* `Q-Anchored` (left, reddish-brown): The bar extends slightly above the 60,000 gridline. Estimated value: ~64,000.
* `A-Anchored` (right, grey): The bar is just below the 20,000 gridline. Estimated value: ~18,000.
2. **Llama-3-70B:**
* `Q-Anchored` (left, reddish-brown): The bar is slightly above the 20,000 gridline. Estimated value: ~24,000.
* `A-Anchored` (right, grey): The bar is below the 20,000 gridline, lower than the Llama-3-8B A-Anchored bar. Estimated value: ~13,000.
3. **Mistral-7B-v0.3:**
* `Q-Anchored` (left, reddish-brown): The bar is between the 40,000 and 60,000 gridlines, closer to 60,000. Estimated value: ~55,000.
* `A-Anchored` (right, grey): The bar is below the 20,000 gridline, similar in height to the Llama-3-70B A-Anchored bar. Estimated value: ~15,000.
4. **Mistral-7B-v0.1:**
* `Q-Anchored` (left, reddish-brown): This is the tallest bar in the chart, extending well above the 60,000 gridline. Estimated value: ~75,000.
* `A-Anchored` (right, grey): The bar is just above the 20,000 gridline. Estimated value: ~22,000.
### Key Observations
1. **Dominant Anchoring Effect:** The most striking pattern is the massive disparity between Q-Anchored and A-Anchored frequencies. Q-Anchored values are 2.5 to 4 times higher than their A-Anchored counterparts for the same model.
2. **Model Performance Variance:** There is significant variation in Q-Anchored performance between models. `Mistral-7B-v0.1` shows the highest frequency, followed by `Llama-3-8B`, then `Mistral-7B-v0.3`, with `Llama-3-70B` showing the lowest.
3. **A-Anchored Consistency:** In contrast, the A-Anchored frequencies are relatively consistent and low across all models, clustering between approximately 13,000 and 22,000.
4. **Notable Outlier:** The `Mistral-7B-v0.1` model's Q-Anchored result is a clear outlier on the high end, suggesting it may be particularly sensitive to or effective with that anchoring method.
### Interpretation
The data strongly suggests that the anchoring method (Q vs. A) is a primary determinant of entity frequency in this evaluation, far more so than the specific model architecture or size (e.g., Llama-3-8B vs. 70B). The "Q-Anchored" condition appears to trigger or elicit a much higher rate of entity generation or recognition.
The variation among models in the Q-Anchored condition could indicate differences in how these models process or are prompted by the "Q" anchor. The relatively flat performance in the A-Anchored condition suggests it may represent a baseline or a less effective prompting strategy that all models handle similarly.
From a Peircean perspective, the chart acts as an *index* pointing to a causal relationship between the anchoring technique and the measured output (entity frequency). The consistent, large-magnitude difference across multiple models (the *iconic* similarity of the pattern) strengthens the hypothesis that this is a robust effect, not an artifact of a single model. The outlier (`Mistral-7B-v0.1`) invites further investigation into what specific characteristics of that model version make it so responsive to Q-Anchoring.