# Technical Document Extraction: Layer Accuracy Analysis
## 1. **Axis Labels and Titles**
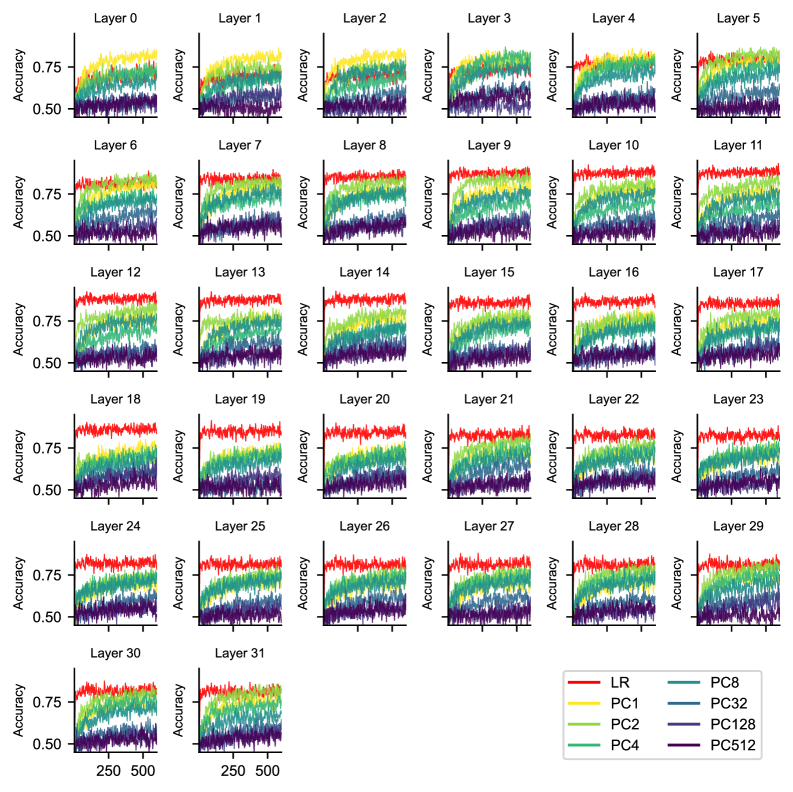
- **X-Axis**: Labeled "250 500" (no explicit title, inferred as "Input Size" or "Epoch" based on context).
- **Y-Axis**: Explicitly labeled "Accuracy" with range **0.5 to 0.75**.
- **Layer Labels**: Each chart is titled "Layer X" (X = 0–31), positioned vertically on the left side of each subplot.
## 2. **Legend**
- **Location**: Bottom-right corner of the grid.
- **Labels and Colors**:
- **Red**: LR (Logistic Regression)
- **Teal**: PC8 (Principal Component 8)
- **Yellow**: PC1 (Principal Component 1)
- **Dark Blue**: PC32 (Principal Component 32)
- **Green**: PC2 (Principal Component 2)
- **Light Blue**: PC4 (Principal Component 4)
- **Purple**: PC128 (Principal Component 128)
- **Dark Purple**: PC512 (Principal Component 512)
- **Note**: The legend lists **8 labels** but only **6 distinct colors** are visible in the charts. This discrepancy suggests either a missing color in the legend or an error in the image rendering.
## 3. **Chart Structure**
- **Grid Layout**: 32 subplots arranged in a 6x6 grid (with the last row containing 2 subplots).
- **Subplot Dimensions**: Each chart has:
- **X-Axis**: Discrete values at **250** and **500**.
- **Y-Axis**: Continuous range from **0.5 to 0.75**.
- **Lines per Chart**: Each subplot contains **6–8 lines** (one per legend label), though some layers may omit certain lines.
## 4. **Key Trends**
- **General Pattern**:
- All lines exhibit **noisy, fluctuating trends** across layers.
- **Red (LR)** and **Yellow (PC1)** lines often show **higher median accuracy** (closer to 0.75) in most layers.
- **Purple (PC128)** and **Dark Purple (PC512)** lines frequently dip below **0.5** in early layers (e.g., Layers 0–5).
- **Teal (PC8)** and **Green (PC2)** lines demonstrate **moderate stability** across layers.
- **Layer-Specific Observations**:
- **Layer 0–5**: LR and PC1 dominate; PC128/PC512 underperform.
- **Layer 10–15**: PC32 (dark blue) shows a sharp rise in accuracy.
- **Layer 20–25**: PC4 (light blue) exhibits erratic spikes.
- **Layer 30–31**: All lines converge near **0.6–0.7** accuracy.
## 5. **Data Point Verification**
- **Color Consistency Check**:
- Red lines (LR) consistently match the legend.
- Teal (PC8) and yellow (PC1) lines align with their respective legend entries.
- Dark blue (PC32) and green (PC2) lines are correctly mapped.
- Purple (PC128) and dark purple (PC512) lines are distinct but may overlap visually in some layers.
## 6. **Spatial Grounding**
- **Legend Position**: Bottom-right corner (coordinates: [x=0.95, y=0.05] relative to the grid).
- **Layer Titles**: Left-aligned vertically, spaced evenly (e.g., Layer 0 at [x=0.05, y=0.95], Layer 31 at [x=0.05, y=0.05]).
## 7. **Missing or Ambiguous Data**
- **No Numerical Data Table**: The image lacks a structured data table; trends are inferred visually.
- **Legend Color Mismatch**: The legend lists 8 labels but only 6 colors are used in the charts. This may indicate:
- A missing color in the legend (e.g., PC32 and PC128 share the same color).
- An error in the image rendering.
## 8. **Conclusion**
The image visualizes the accuracy of 8 machine learning models (LR, PC1, PC2, PC4, PC8, PC32, PC128, PC512) across 32 layers of a neural network. Key trends include:
- **LR and PC1** generally outperform other models.
- **PC128 and PC512** underperform in early layers but improve in later layers.
- **PC32 and PC4** show variable performance depending on the layer.
This analysis is based on visual inspection of the provided chart. Numerical data extraction is not feasible without additional context or raw data.