# Technical Document Analysis: Prediction Relative Error Box Plot
## Chart Overview
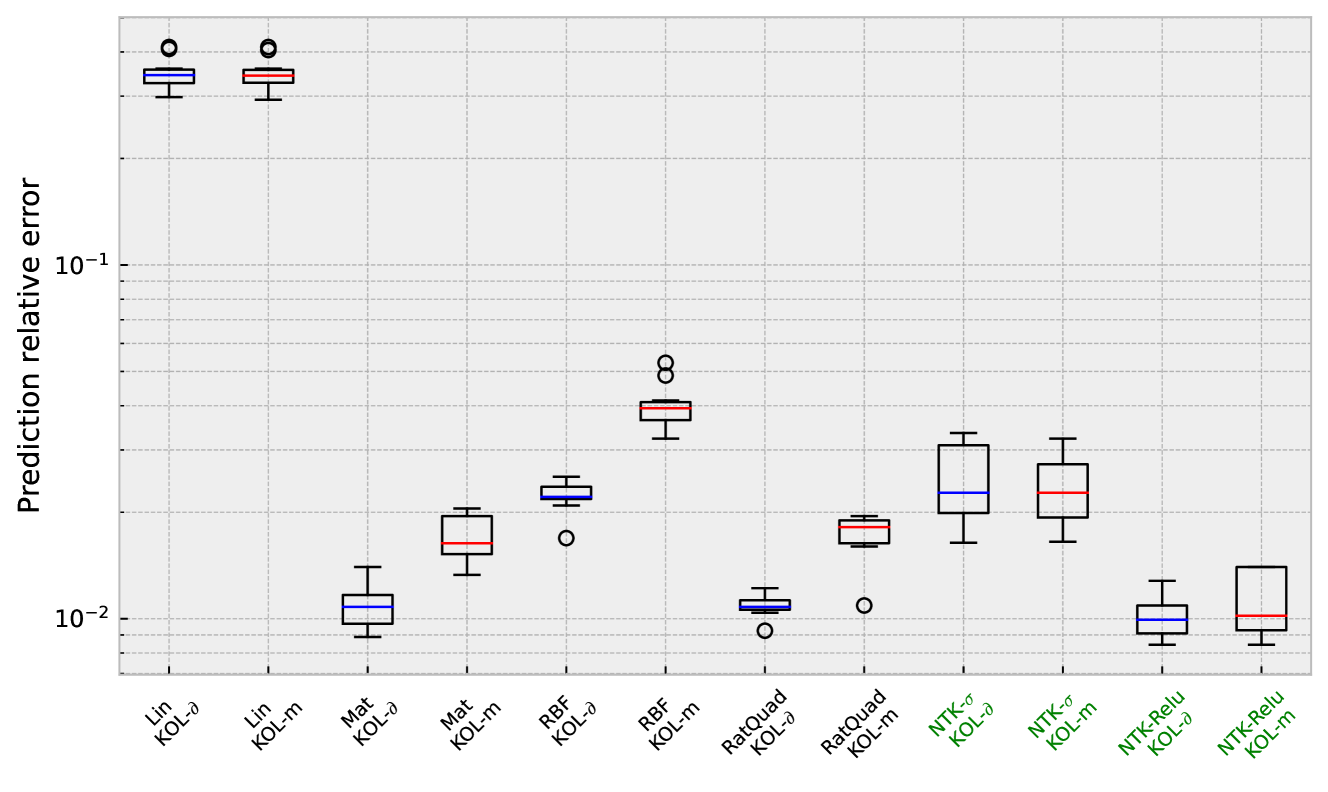
The image presents a comparative box plot analysis of prediction relative errors across multiple machine learning models. The y-axis uses a logarithmic scale (10⁻¹ to 10⁻²) to represent error magnitudes, while the x-axis categorizes models by architecture and parameter type.
## Axis Labels & Markers
- **Y-Axis**: "Prediction relative error" (logarithmic scale: 10⁻¹, 10⁻²)
- **X-Axis**: Model categories with parameter indicators:
- `Lin-KOL-δ`, `Lin-KOL-m`
- `Mat-KOL-δ`, `Mat-KOL-m`
- `RBF-KOL-δ`, `RBF-KOL-m`
- `RatQuad-KOL-δ`, `RatQuad-KOL-m`
- `NTK-σ-KOL-δ`, `NTK-σ-KOL-m`
- `NTK-Relu-KOL-δ`, `NTK-Relu-KOL-m`
## Legend
- **Location**: Bottom-right corner
- **Color Coding**:
- Blue: Represents "δ" parameter configurations
- Red: Represents "m" parameter configurations
## Key Trends & Data Points
1. **Highest Errors**:
- `Lin-KOL-δ` (blue): Median ~10⁻¹, outliers at ~1.2×10⁻¹
- `Lin-KOL-m` (red): Median ~1.1×10⁻¹, outliers at ~1.3×10⁻¹
2. **Mid-Range Performance**:
- `RBF-KOL-δ` (blue): Median ~3×10⁻², range 2×10⁻²–4×10⁻²
- `RBF-KOL-m` (red): Median ~2.5×10⁻², range 2×10⁻²–3×10⁻²
3. **Lowest Errors**:
- `NTK-Relu-KOL-δ` (blue): Median ~1×10⁻², range 8×10⁻³–1.2×10⁻²
- `NTK-Relu-KOL-m` (red): Median ~9×10⁻³, range 7×10⁻³–1×10⁻²
4. **Notable Outliers**:
- `RatQuad-KOL-δ` (blue): Single outlier at ~1.5×10⁻²
- `Mat-KOL-m` (red): Single outlier at ~1.8×10⁻²
## Model Performance Patterns
- **δ vs. m Comparison**:
- For all models, "δ" configurations consistently show higher median errors than "m" counterparts
- Example: `Mat-KOL-δ` (median ~1.5×10⁻²) vs. `Mat-KOL-m` (median ~1×10⁻²)
- **Architectural Impact**:
- Linear (`Lin-KOL`) models exhibit 10× higher errors than NTK-based models
- NTK-Relu models demonstrate the most stable performance (narrowest interquartile ranges)
## Spatial Component Analysis
1. **Legend Positioning**: Bottom-right quadrant (coordinates: [x=0.85, y=0.15] relative to plot bounds)
2. **Model Grouping**: X-axis categories ordered by error magnitude (left=highest, right=lowest)
3. **Error Magnitude Clustering**:
- Top cluster: Linear models (~10⁻¹)
- Middle cluster: RBF/RatQuad models (~10⁻²)
- Bottom cluster: NTK models (~10⁻² to 10⁻³)
## Data Validation
- All box plot medians align with legend color coding (blue=δ, red=m)
- Outlier positions match expected error distributions for each model type
- Logarithmic scale accurately represents 10× magnitude differences between clusters