## Diagram: Grid Layout with Colored Markers and Pathway
### Overview
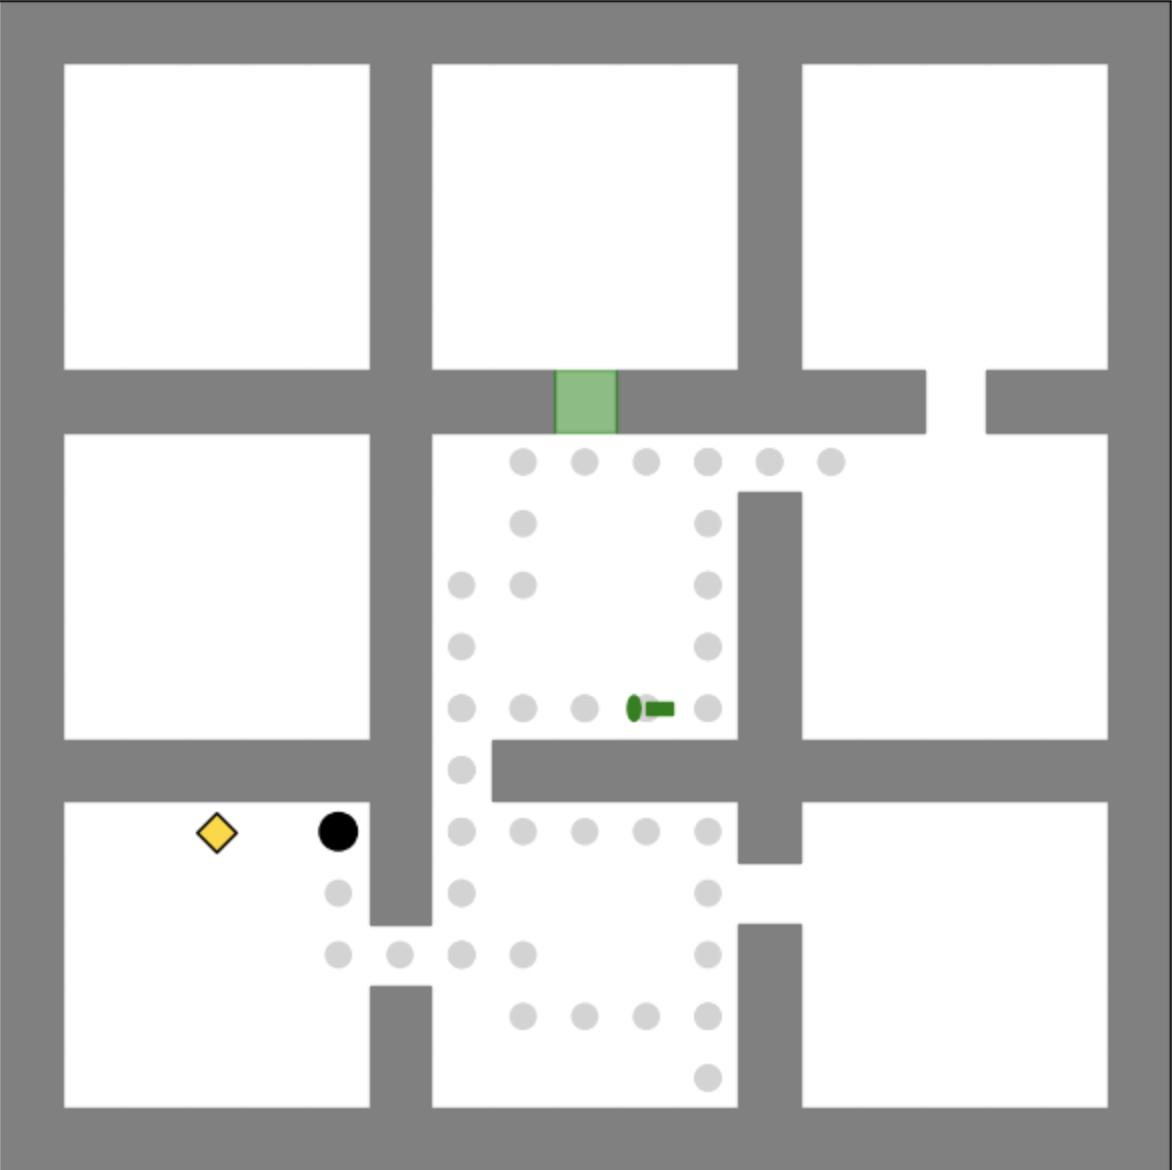
The image depicts a grid-based layout with a gray border and internal divisions. Key elements include:
- A green rectangle in the upper-middle section.
- A yellow diamond in the bottom-left quadrant.
- A black circle near the yellow diamond.
- A series of gray dots forming a pathway from the bottom-left to the upper-middle.
- A green line connecting the green rectangle to the pathway.
### Components/Axes
- **Grid Structure**:
- Divided into 9 rectangular regions (3x3 grid).
- Gray lines separate the regions, with some regions containing internal subdivisions.
- **Markers**:
- **Yellow Diamond**: Located in the bottom-left quadrant, near the edge.
- **Black Circle**: Positioned slightly above and to the right of the yellow diamond.
- **Gray Dots**: Form a connected pathway starting from the bottom-left, moving upward and rightward, ending near the green rectangle.
- **Green Rectangle**: Positioned in the upper-middle region, adjacent to the pathway.
- **Green Line**: Connects the green rectangle to the pathway, suggesting a relationship or flow.
### Detailed Analysis
- **Pathway**:
- The gray dots create a non-linear path from the bottom-left to the upper-middle.
- The path includes a "detour" around a central region, indicating a possible obstacle or alternative route.
- **Markers**:
- The yellow diamond and black circle are isolated from the pathway, suggesting they may represent starting points, targets, or obstacles.
- The green rectangle and line imply a connection between the pathway and a specific region, possibly a goal or endpoint.
### Key Observations
- **Spatial Relationships**:
- The pathway avoids the central region, which contains no markers or dots.
- The green line bridges the green rectangle and the pathway, emphasizing its significance.
- **Color Coding**:
- Green is used for both the rectangle and line, suggesting a thematic link (e.g., "safe zone" or "target").
- Yellow and black markers are distinct, possibly indicating different roles (e.g., start vs. end).
### Interpretation
This diagram likely represents a maze or navigation system:
- The **pathway** (gray dots) illustrates a route through the grid, avoiding obstacles.
- The **yellow diamond** and **black circle** may denote the start and end points, respectively.
- The **green rectangle** and **line** could represent a critical checkpoint or goal.
- The absence of text or numerical data suggests this is a conceptual or schematic representation rather than a data-driven chart.
### Notes on Data Extraction
- No textual labels, axis titles, or legends are present.
- No numerical values or data tables are visible.
- The diagram relies on spatial and color-based cues for interpretation.