## Line Chart: EGA vs Episode for Different Alpha Values
### Overview
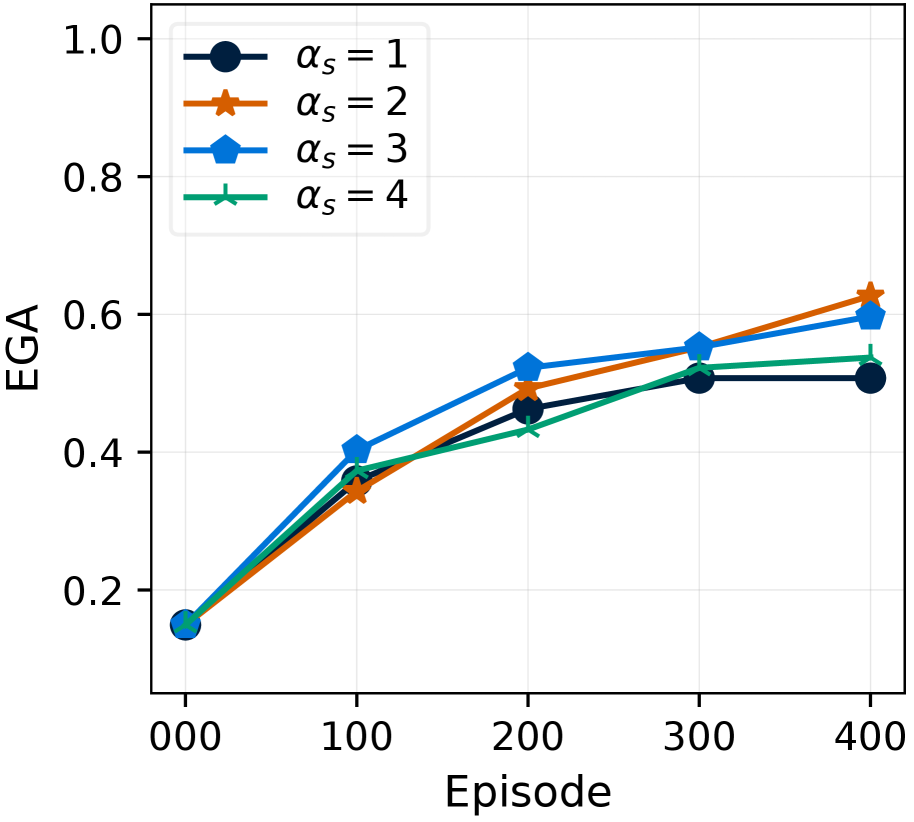
The image is a line chart showing the relationship between EGA (Estimated Generalization Ability) and Episode number for four different values of alpha (αs = 1, 2, 3, 4). The chart displays how EGA changes over episodes for each alpha value.
### Components/Axes
* **X-axis (Horizontal):** Episode, with markers at 000, 100, 200, 300, and 400.
* **Y-axis (Vertical):** EGA, ranging from 0.0 to 1.0, with markers at 0.2, 0.4, 0.6, 0.8, and 1.0.
* **Legend (Top-Left):**
* Dark Blue line with circle marker: αs = 1
* Orange line with star marker: αs = 2
* Blue line with pentagon marker: αs = 3
* Green line with plus marker: αs = 4
### Detailed Analysis
* **αs = 1 (Dark Blue, Circle):**
* Trend: Increases from Episode 0 to Episode 200, then plateaus.
* Data Points:
* Episode 0: EGA ≈ 0.15
* Episode 100: EGA ≈ 0.37
* Episode 200: EGA ≈ 0.51
* Episode 300: EGA ≈ 0.51
* Episode 400: EGA ≈ 0.51
* **αs = 2 (Orange, Star):**
* Trend: Increases steadily from Episode 0 to Episode 400.
* Data Points:
* Episode 0: EGA ≈ 0.15
* Episode 100: EGA ≈ 0.37
* Episode 200: EGA ≈ 0.47
* Episode 300: EGA ≈ 0.55
* Episode 400: EGA ≈ 0.63
* **αs = 3 (Blue, Pentagon):**
* Trend: Increases sharply from Episode 0 to Episode 200, then plateaus.
* Data Points:
* Episode 0: EGA ≈ 0.15
* Episode 100: EGA ≈ 0.41
* Episode 200: EGA ≈ 0.53
* Episode 300: EGA ≈ 0.56
* Episode 400: EGA ≈ 0.60
* **αs = 4 (Green, Plus):**
* Trend: Increases from Episode 0 to Episode 200, then plateaus.
* Data Points:
* Episode 0: EGA ≈ 0.15
* Episode 100: EGA ≈ 0.35
* Episode 200: EGA ≈ 0.45
* Episode 300: EGA ≈ 0.51
* Episode 400: EGA ≈ 0.59
### Key Observations
* All alpha values start at approximately the same EGA value (0.15) at Episode 0.
* αs = 3 (Blue) shows the highest EGA values up to Episode 400.
* αs = 1 (Dark Blue) plateaus early, showing the lowest EGA values after Episode 200.
* αs = 2 (Orange) shows a steady increase in EGA throughout the episodes.
* αs = 4 (Green) increases and then plateaus, ending with a value between αs = 1 and αs = 3.
### Interpretation
The chart suggests that the choice of alpha value significantly impacts the Estimated Generalization Ability (EGA) over training episodes. An alpha value of 3 appears to provide the best EGA performance initially, but αs = 2 catches up by episode 400. Alpha values of 1 and 4 result in lower EGA values and plateau earlier, indicating that they might not be as effective for long-term generalization. The data implies that there is an optimal alpha value for maximizing EGA, and this value may depend on the number of training episodes.