## Line Graph: EGA vs. Episodes for Different α_s Values
### Overview
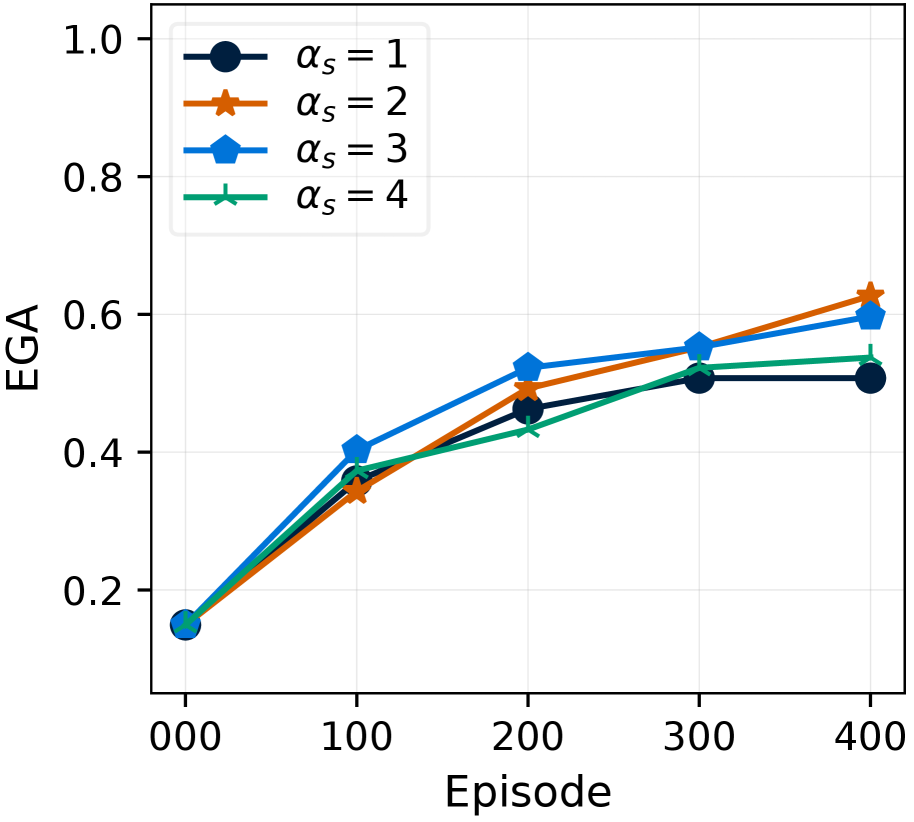
The image depicts a line graph illustrating the relationship between "Episode" (x-axis) and "EGA" (y-axis) across four distinct α_s values (1, 2, 3, 4). The graph shows four data series, each represented by a unique color and marker, starting from the same initial point and diverging as episodes increase. The legend is positioned in the top-left corner, and all lines exhibit upward trends with varying slopes.
---
### Components/Axes
- **X-axis (Episode)**: Labeled "Episode," ranging from 0 to 400 in increments of 100.
- **Y-axis (EGA)**: Labeled "EGA," ranging from 0.0 to 1.0 in increments of 0.2.
- **Legend**: Located in the top-left corner, mapping:
- **α_s = 1**: Black circle (●)
- **α_s = 2**: Orange star (★)
- **α_s = 3**: Blue diamond (◆)
- **α_s = 4**: Green cross (✖️)
---
### Detailed Analysis
#### Data Series Trends
1. **α_s = 1 (Black Circle)**:
- Starts at ~0.15 EGA at 0 episodes.
- Increases to ~0.35 at 100 episodes, ~0.45 at 200, ~0.5 at 300, and plateaus at ~0.5 by 400 episodes.
- **Trend**: Gradual rise followed by stabilization.
2. **α_s = 2 (Orange Star)**:
- Starts at ~0.15 EGA at 0 episodes.
- Increases to ~0.35 at 100 episodes, ~0.48 at 200, ~0.55 at 300, and ~0.62 at 400.
- **Trend**: Steeper slope than α_s = 1, with consistent growth.
3. **α_s = 3 (Blue Diamond)**:
- Starts at ~0.15 EGA at 0 episodes.
- Increases to ~0.4 at 100 episodes, ~0.52 at 200, ~0.55 at 300, and ~0.6 at 400.
- **Trend**: Faster initial growth than α_s = 1, but slower than α_s = 2.
4. **α_s = 4 (Green Cross)**:
- Starts at ~0.15 EGA at 0 episodes.
- Increases to ~0.38 at 100 episodes, ~0.46 at 200, ~0.52 at 300, and ~0.55 at 400.
- **Trend**: Moderate growth, surpassing α_s = 1 but lagging behind α_s = 2 and 3.
---
### Key Observations
1. **Initial Convergence**: All lines begin at ~0.15 EGA at 0 episodes, indicating identical starting conditions.
2. **Divergence**: By 100 episodes, α_s = 3 (blue diamond) leads, followed by α_s = 2 (orange star), α_s = 4 (green cross), and α_s = 1 (black circle).
3. **Plateau for α_s = 1**: The black circle line flattens after 200 episodes, suggesting diminishing returns or a saturation effect.
4. **α_s = 2 Dominance**: By 400 episodes, α_s = 2 achieves the highest EGA (~0.62), outperforming all other values.
---
### Interpretation
- **α_s Impact**: Higher α_s values (2, 3, 4) correlate with steeper EGA growth, implying α_s is a critical parameter influencing the rate of EGA increase.
- **Saturation Hypothesis**: The plateau in α_s = 1 suggests a potential upper limit to EGA growth under this parameter setting.
- **Efficiency Trade-off**: While α_s = 2 achieves the highest EGA, its trajectory may involve higher computational or resource costs (not shown here).
- **Legend Consistency**: All markers and colors align precisely with their respective α_s values, confirming accurate data series identification.
This graph highlights the trade-off between α_s magnitude and EGA performance, with α_s = 2 emerging as the most effective parameter for maximizing EGA over 400 episodes.