## Line Graph: Average Incorrect Flips Over Iterations
### Overview
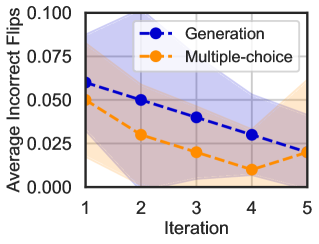
The graph compares two methods ("Generation" and "Multiple-choice") across five iterations, measuring their average incorrect flips. Both methods show a downward trend, but "Generation" consistently exhibits higher error rates than "Multiple-choice." Shaded regions around the lines represent confidence intervals, with "Generation" having wider variability.
### Components/Axes
- **X-axis (Iteration)**: Labeled "Iteration," with markers at 1, 2, 3, 4, and 5.
- **Y-axis (Average Incorrect Flips)**: Labeled "Average Incorrect Flips," scaled from 0.000 to 0.100 in increments of 0.025.
- **Legend**: Located in the top-right corner, with:
- **Blue dashed line**: "Generation"
- **Orange dashed line**: "Multiple-choice"
- **Shaded Regions**: Light blue (Generation) and light orange (Multiple-choice) indicate confidence intervals.
### Detailed Analysis
- **Generation (Blue)**:
- Iteration 1: ~0.060
- Iteration 2: ~0.050
- Iteration 3: ~0.040
- Iteration 4: ~0.030
- Iteration 5: ~0.020
- Trend: Steady decline with a slight plateau between iterations 4–5.
- Confidence interval: ±~0.015 (wider than Multiple-choice).
- **Multiple-choice (Orange)**:
- Iteration 1: ~0.050
- Iteration 2: ~0.040
- Iteration 3: ~0.030
- Iteration 4: ~0.020
- Iteration 5: ~0.015
- Trend: Consistent linear decline.
- Confidence interval: ±~0.010.
### Key Observations
1. **Error Reduction**: Both methods improve over iterations, but "Multiple-choice" achieves lower final error rates (~0.015 vs. ~0.020 for "Generation").
2. **Variability**: "Generation" shows greater uncertainty in its measurements, as evidenced by its broader confidence intervals.
3. **Convergence**: The gap between the two methods narrows slightly in later iterations but remains significant.
### Interpretation
The data suggests that while both methods reduce errors with more iterations, "Multiple-choice" is more reliable and efficient in minimizing incorrect flips. The persistent higher error rate in "Generation" could indicate inherent limitations in its approach, such as sensitivity to noise or suboptimal parameter tuning. The widening confidence intervals for "Generation" imply less predictability, which might make it riskier for applications requiring consistent performance. This analysis could guide resource allocation or algorithm selection in scenarios where error minimization is critical.