## Line Chart: Average Incorrect Flips vs. Iteration
### Overview
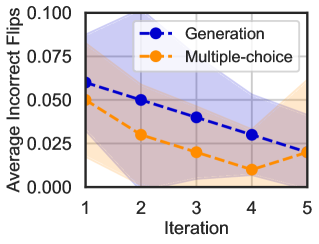
The image is a line chart comparing the average incorrect flips for two methods, "Generation" and "Multiple-choice," across five iterations. The chart displays the trend of incorrect flips decreasing with increasing iterations for both methods, with shaded regions indicating the variability or confidence intervals around the mean values.
### Components/Axes
* **Y-axis:** "Average Incorrect Flips," ranging from 0.000 to 0.100 in increments of 0.025.
* **X-axis:** "Iteration," ranging from 1 to 5 in increments of 1.
* **Legend:** Located in the top-right corner.
* "Generation": Represented by a blue dashed line with circular markers.
* "Multiple-choice": Represented by an orange dashed line with circular markers.
* **Shaded Regions:** Light blue shading around the "Generation" line and light orange shading around the "Multiple-choice" line, indicating variability.
### Detailed Analysis
* **Generation:**
* Trend: The blue dashed line shows a decreasing trend in average incorrect flips as the iteration number increases.
* Data Points:
* Iteration 1: Approximately 0.062
* Iteration 2: Approximately 0.050
* Iteration 3: Approximately 0.040
* Iteration 4: Approximately 0.030
* Iteration 5: Approximately 0.022
* **Multiple-choice:**
* Trend: The orange dashed line also shows a decreasing trend initially, but it flattens out and slightly increases towards the end.
* Data Points:
* Iteration 1: Approximately 0.052
* Iteration 2: Approximately 0.032
* Iteration 3: Approximately 0.020
* Iteration 4: Approximately 0.010
* Iteration 5: Approximately 0.025
### Key Observations
* Both methods show a general decrease in average incorrect flips as the iteration number increases, suggesting learning or improvement over time.
* The "Generation" method starts with a higher average incorrect flip rate but decreases more consistently than the "Multiple-choice" method.
* The "Multiple-choice" method has a lower average incorrect flip rate at iteration 4, but it increases slightly at iteration 5.
* The shaded regions indicate the variability in the data, with wider regions suggesting more uncertainty.
### Interpretation
The data suggests that both the "Generation" and "Multiple-choice" methods improve over iterations in terms of reducing incorrect flips. The "Generation" method, despite starting with a higher error rate, shows a more consistent improvement. The "Multiple-choice" method initially performs better but plateaus and shows a slight increase in errors at the last iteration. This could indicate that the "Generation" method is learning more effectively over time, while the "Multiple-choice" method might be reaching a limit or experiencing some overfitting. The shaded regions provide insight into the reliability of these trends, with wider regions suggesting more caution in interpreting the results.