\n
## Line Chart: Average Incorrect Flips vs. Iteration
### Overview
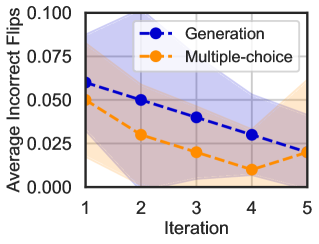
This image presents a line chart illustrating the relationship between the iteration number and the average number of incorrect flips for two different methods: "Generation" and "Multiple-choice". The chart includes shaded regions representing the uncertainty or variance around each line.
### Components/Axes
* **X-axis:** Iteration, ranging from 1 to 5.
* **Y-axis:** Average Incorrect Flips, ranging from 0.000 to 0.100.
* **Data Series 1:** "Generation" - Represented by a blue dashed line with circular markers.
* **Data Series 2:** "Multiple-choice" - Represented by an orange dashed line with circular markers.
* **Legend:** Located in the top-right corner, associating colors with the methods.
* **Shaded Regions:** Light blue and light orange areas surrounding each line, indicating the variance or confidence interval.
### Detailed Analysis
**Generation (Blue Line):**
The blue line shows a decreasing trend, indicating a reduction in average incorrect flips as the iteration number increases.
* Iteration 1: Approximately 0.063
* Iteration 2: Approximately 0.053
* Iteration 3: Approximately 0.045
* Iteration 4: Approximately 0.033
* Iteration 5: Approximately 0.025
**Multiple-choice (Orange Line):**
The orange line also exhibits a decreasing trend, but the rate of decrease appears more pronounced initially and then plateaus.
* Iteration 1: Approximately 0.043
* Iteration 2: Approximately 0.033
* Iteration 3: Approximately 0.023
* Iteration 4: Approximately 0.018
* Iteration 5: Approximately 0.012
The shaded regions around each line indicate the uncertainty in the data. The blue shaded region is wider, suggesting greater variance in the "Generation" method's performance. The orange shaded region is narrower, indicating more consistent performance for the "Multiple-choice" method.
### Key Observations
* Both methods demonstrate a reduction in average incorrect flips with increasing iterations.
* The "Multiple-choice" method consistently exhibits a lower average incorrect flip rate than the "Generation" method across all iterations.
* The "Generation" method has a larger variance in its performance, as indicated by the wider shaded region.
* The rate of improvement for the "Multiple-choice" method appears to slow down after iteration 3.
### Interpretation
The chart suggests that both the "Generation" and "Multiple-choice" methods improve with iterative refinement, as evidenced by the decreasing trend in incorrect flips. However, the "Multiple-choice" method consistently outperforms the "Generation" method, indicating it is a more effective approach for this particular task. The wider variance in the "Generation" method suggests that its performance is more sensitive to variations in the input or process. The plateauing improvement in the "Multiple-choice" method after iteration 3 might indicate a point of diminishing returns, where further iterations yield only marginal improvements. This data could be used to inform decisions about which method to prioritize for further development or deployment, and to optimize the number of iterations used in the process. The chart demonstrates a clear relationship between iterative refinement and performance improvement, highlighting the importance of iterative processes in achieving desired outcomes.