## Line Chart: Average Incorrect Flips Over Iterations
### Overview
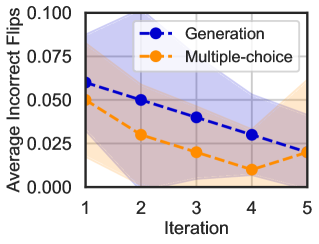
The image is a line chart comparing the performance of two methods, "Generation" and "Multiple-choice," across five iterations. The performance metric is the "Average Incorrect Flips," where a lower value indicates better performance. Both methods show a general downward trend, suggesting improvement over successive iterations. The chart includes shaded regions around each line, representing confidence intervals or variability in the data.
### Components/Axes
* **Chart Type:** Line chart with shaded confidence bands.
* **X-Axis (Horizontal):**
* **Label:** "Iteration"
* **Scale:** Discrete, linear scale from 1 to 5.
* **Markers:** Major ticks at integers 1, 2, 3, 4, 5.
* **Y-Axis (Vertical):**
* **Label:** "Average Incorrect Flips"
* **Scale:** Linear scale from 0.000 to 0.100.
* **Markers:** Major ticks at 0.000, 0.025, 0.050, 0.075, 0.100.
* **Legend:**
* **Position:** Top-right corner of the plot area.
* **Series 1:** "Generation" - Represented by a dark blue dashed line with circular markers.
* **Series 2:** "Multiple-choice" - Represented by an orange dashed line with circular markers.
* **Data Series & Confidence Bands:**
* Each line is surrounded by a semi-transparent shaded area of the corresponding color (blue for Generation, orange for Multiple-choice), indicating the range of uncertainty or variance around the mean value.
### Detailed Analysis
**Trend Verification:**
* **Generation (Blue Line):** The line exhibits a clear downward slope from iteration 1 to iteration 5, indicating a consistent reduction in average incorrect flips.
* **Multiple-choice (Orange Line):** The line also slopes downward from iteration 1 to iteration 4, showing improvement. Between iteration 4 and 5, the trend flattens or shows a very slight upward inflection.
**Data Point Extraction (Approximate Values):**
* **Iteration 1:**
* Generation: ~0.060
* Multiple-choice: ~0.050
* **Iteration 2:**
* Generation: ~0.050
* Multiple-choice: ~0.030
* **Iteration 3:**
* Generation: ~0.040
* Multiple-choice: ~0.020
* **Iteration 4:**
* Generation: ~0.030
* Multiple-choice: ~0.010
* **Iteration 5:**
* Generation: ~0.020
* Multiple-choice: ~0.015 (slight increase from iteration 4)
**Confidence Interval Observation:**
* The shaded confidence band for the "Generation" method is notably wider than that for "Multiple-choice," especially in the earlier iterations (1-3). This suggests greater variability or less certainty in the performance of the Generation method during the initial phases.
* The confidence bands for the two methods overlap significantly across all iterations, particularly from iteration 2 onward.
### Key Observations
1. **Initial Performance Gap:** At iteration 1, the "Multiple-choice" method starts with a lower average incorrect flip rate (~0.050) compared to the "Generation" method (~0.060).
2. **Rate of Improvement:** The "Generation" method shows a steeper initial decline between iterations 1 and 2. The "Multiple-choice" method improves steadily until iteration 4.
3. **Convergence and Divergence:** The performance of the two methods appears to converge around iteration 5, with both achieving low error rates (between 0.015 and 0.020). However, the "Multiple-choice" method shows a potential plateau or slight regression at the final step.
4. **Uncertainty:** The wide confidence interval for "Generation" implies that while its average performance improves, individual results may vary considerably. The "Multiple-choice" method's tighter band suggests more consistent performance.
### Interpretation
The chart demonstrates that both the "Generation" and "Multiple-choice" methods are effective at reducing errors (incorrect flips) over successive iterations, likely in a machine learning or optimization context. The "Multiple-choice" approach appears to offer a more consistent and initially superior performance, achieving lower error rates faster. However, the "Generation" method, despite higher initial error and variability, catches up by the fifth iteration.
The overlapping confidence intervals are a critical detail. They suggest that the observed differences in average performance between the two methods at any given iteration may not be statistically significant. A practitioner would need to consider this uncertainty; the apparent advantage of "Multiple-choice" might be less definitive than the mean lines alone suggest.
The slight uptick for "Multiple-choice" at iteration 5 could indicate a point of diminishing returns, potential overfitting, or simply noise within the confidence interval. This anomaly warrants further investigation to determine if it's a meaningful pattern or a random fluctuation.
**In summary:** The data suggests both methods are viable for reducing errors over time. "Multiple-choice" may be preferred for its consistency and faster initial gains, while "Generation" is a competitive alternative that achieves similar final performance, albeit with higher variability during the process. The choice between them might depend on the importance of early-stage performance versus final outcome, and the tolerance for result variability.