## Heatmaps: Normalized Error Comparison
### Overview
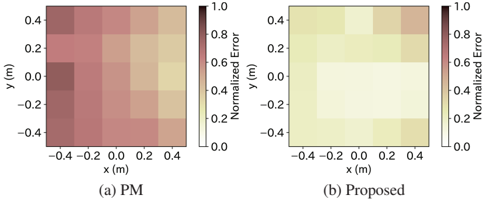
The image presents two heatmaps comparing the normalized error of two methods: "PM" and a "Proposed" method. The heatmaps display error values across a spatial grid, with the x and y axes representing spatial coordinates in meters. A color bar indicates the error magnitude, ranging from 0.0 (low error) to 1.0 (high error).
### Components/Axes
* **X-axis:** Represents the x-coordinate in meters (m), ranging from -0.4 to 0.4 with increments of 0.2.
* **Y-axis:** Represents the y-coordinate in meters (m), ranging from -0.4 to 0.4 with increments of 0.2.
* **Color Bar:** Indicates the normalized error, ranging from 0.0 (lightest color) to 1.0 (darkest color).
* **Titles:**
* (a) PM
* (b) Proposed
* **Axis Label:** Normalized Error
### Detailed Analysis
**Heatmap (a) PM:**
* The error appears to be higher in the bottom-left quadrant of the grid.
* The error decreases towards the top-right quadrant.
* Specific error values (approximate, based on color):
* (-0.4, 0.4): ~0.6
* (-0.4, 0.2): ~0.8
* (-0.4, 0.0): ~0.8
* (-0.4, -0.2): ~0.6
* (-0.4, -0.4): ~0.6
* (-0.2, 0.4): ~0.6
* (-0.2, 0.2): ~0.6
* (-0.2, 0.0): ~0.6
* (-0.2, -0.2): ~0.6
* (-0.2, -0.4): ~0.6
* (0.0, 0.4): ~0.4
* (0.0, 0.2): ~0.4
* (0.0, 0.0): ~0.4
* (0.0, -0.2): ~0.4
* (0.0, -0.4): ~0.4
* (0.2, 0.4): ~0.4
* (0.2, 0.2): ~0.4
* (0.2, 0.0): ~0.4
* (0.2, -0.2): ~0.4
* (0.2, -0.4): ~0.4
* (0.4, 0.4): ~0.4
* (0.4, 0.2): ~0.4
* (0.4, 0.0): ~0.4
* (0.4, -0.2): ~0.4
* (0.4, -0.4): ~0.4
**Heatmap (b) Proposed:**
* The error is generally lower across the entire grid compared to the "PM" method.
* The error appears relatively uniform across the grid.
* Specific error values (approximate, based on color):
* (-0.4, 0.4): ~0.2
* (-0.4, 0.2): ~0.2
* (-0.4, 0.0): ~0.2
* (-0.4, -0.2): ~0.2
* (-0.4, -0.4): ~0.2
* (-0.2, 0.4): ~0.2
* (-0.2, 0.2): ~0.2
* (-0.2, 0.0): ~0.2
* (-0.2, -0.2): ~0.2
* (-0.2, -0.4): ~0.2
* (0.0, 0.4): ~0.2
* (0.0, 0.2): ~0.2
* (0.0, 0.0): ~0.2
* (0.0, -0.2): ~0.2
* (0.0, -0.4): ~0.2
* (0.2, 0.4): ~0.2
* (0.2, 0.2): ~0.2
* (0.2, 0.0): ~0.2
* (0.2, -0.2): ~0.2
* (0.2, -0.4): ~0.2
* (0.4, 0.4): ~0.2
* (0.4, 0.2): ~0.2
* (0.4, 0.0): ~0.2
* (0.4, -0.2): ~0.2
* (0.4, -0.4): ~0.2
### Key Observations
* The "Proposed" method exhibits significantly lower normalized error compared to the "PM" method across the spatial grid.
* The "PM" method shows a higher concentration of error in the bottom-left quadrant.
* The "Proposed" method demonstrates a more uniform error distribution.
### Interpretation
The heatmaps visually demonstrate that the "Proposed" method outperforms the "PM" method in terms of normalized error across the spatial area represented. The "PM" method appears to be more susceptible to errors in the bottom-left region, while the "Proposed" method maintains a consistently low error rate throughout the grid. This suggests that the "Proposed" method is more robust and accurate than the "PM" method for the application being evaluated.