\n
## Heatmaps: Normalized Error Comparison
### Overview
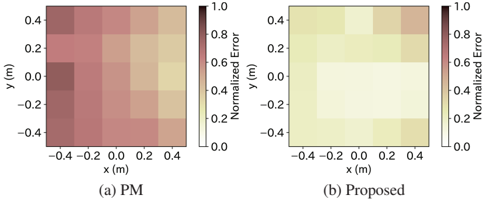
The image presents two heatmaps, labeled (a) PM and (b) Proposed, displaying normalized error values across a 2D space defined by x and y coordinates. Both heatmaps share the same axes and color scale, allowing for a direct visual comparison of error distribution between the two methods.
### Components/Axes
* **X-axis:** Labeled "x (m)", ranging from approximately -0.4 meters to 0.4 meters.
* **Y-axis:** Labeled "y (m)", ranging from approximately -0.4 meters to 0.4 meters.
* **Color Scale:** Represents "Normalized Error", ranging from 0.0 to 1.0. The scale is positioned to the right of each heatmap.
* **Labels:**
* (a) PM: Indicates the first heatmap represents the "PM" method.
* (b) Proposed: Indicates the second heatmap represents the "Proposed" method.
### Detailed Analysis or Content Details
**Heatmap (a) PM:**
The heatmap shows a gradient of color, with darker shades of red indicating higher normalized error and lighter shades indicating lower error.
* **Top-Left Corner (x ≈ -0.4, y ≈ 0.4):** Normalized Error ≈ 0.7 - 0.8.
* **Top-Center (x ≈ 0.0, y ≈ 0.4):** Normalized Error ≈ 0.6 - 0.7.
* **Top-Right Corner (x ≈ 0.4, y ≈ 0.4):** Normalized Error ≈ 0.6 - 0.7.
* **Center-Left (x ≈ -0.4, y ≈ 0.0):** Normalized Error ≈ 0.7 - 0.8.
* **Center-Center (x ≈ 0.0, y ≈ 0.0):** Normalized Error ≈ 0.4 - 0.5.
* **Center-Right (x ≈ 0.4, y ≈ 0.0):** Normalized Error ≈ 0.5 - 0.6.
* **Bottom-Left Corner (x ≈ -0.4, y ≈ -0.4):** Normalized Error ≈ 0.8 - 0.9.
* **Bottom-Center (x ≈ 0.0, y ≈ -0.4):** Normalized Error ≈ 0.6 - 0.7.
* **Bottom-Right Corner (x ≈ 0.4, y ≈ -0.4):** Normalized Error ≈ 0.5 - 0.6.
**Heatmap (b) Proposed:**
This heatmap exhibits significantly lower normalized error values compared to the "PM" method. The colors are predominantly light yellow and pale green.
* **Top-Left Corner (x ≈ -0.4, y ≈ 0.4):** Normalized Error ≈ 0.2 - 0.3.
* **Top-Center (x ≈ 0.0, y ≈ 0.4):** Normalized Error ≈ 0.1 - 0.2.
* **Top-Right Corner (x ≈ 0.4, y ≈ 0.4):** Normalized Error ≈ 0.1 - 0.2.
* **Center-Left (x ≈ -0.4, y ≈ 0.0):** Normalized Error ≈ 0.2 - 0.3.
* **Center-Center (x ≈ 0.0, y ≈ 0.0):** Normalized Error ≈ 0.05 - 0.1.
* **Center-Right (x ≈ 0.4, y ≈ 0.0):** Normalized Error ≈ 0.1 - 0.2.
* **Bottom-Left Corner (x ≈ -0.4, y ≈ -0.4):** Normalized Error ≈ 0.3 - 0.4.
* **Bottom-Center (x ≈ 0.0, y ≈ -0.4):** Normalized Error ≈ 0.1 - 0.2.
* **Bottom-Right Corner (x ≈ 0.4, y ≈ -0.4):** Normalized Error ≈ 0.1 - 0.2.
### Key Observations
* The "Proposed" method consistently demonstrates lower normalized error across the entire 2D space compared to the "PM" method.
* The "PM" method exhibits higher error values, particularly in the bottom-left corner (x ≈ -0.4, y ≈ -0.4).
* The "Proposed" method shows the lowest error values around the center of the space (x ≈ 0.0, y ≈ 0.0).
* Both heatmaps show a general trend of lower error towards the center of the space.
### Interpretation
The data suggests that the "Proposed" method significantly outperforms the "PM" method in terms of normalized error across the examined spatial domain. The heatmaps visually demonstrate a substantial reduction in error when using the "Proposed" approach. This could indicate that the "Proposed" method is more accurate, robust, or better suited for the specific task or environment represented by the x and y coordinates. The higher error values observed in the bottom-left corner for the "PM" method might suggest a sensitivity to certain conditions or parameters within that region of the space. The consistent low error of the "Proposed" method suggests a more stable and reliable performance. The x and y coordinates likely represent physical dimensions or input parameters to a model, and the normalized error represents the difference between the model's prediction and the actual value. The data implies that the "Proposed" method provides a more accurate representation of the underlying phenomenon.