## Heatmaps: Normalized Error Distribution Comparison
### Overview
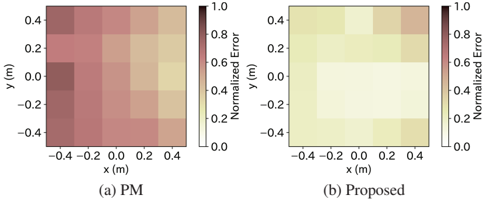
The image presents two side-by-side heatmaps comparing normalized error distributions across a 2D spatial grid. The left heatmap (a) represents a baseline method labeled "PM," while the right heatmap (b) represents a "Proposed" method. Both maps use color gradients to encode error magnitudes, with darker red indicating higher errors and lighter yellow indicating lower errors.
### Components/Axes
- **X-axis**: Labeled "x (m)" with values ranging from -0.4 m to 0.4 m in 0.2 m increments.
- **Y-axis**: Labeled "y (m)" with values ranging from -0.4 m to 0.4 m in 0.2 m increments.
- **Color Scale**: Shared legend on the right of each heatmap, labeled "Normalized Error" with values from 0.0 (light yellow) to 1.0 (dark red).
- **Legend Positioning**: Right-aligned for both heatmaps, occupying ~20% of the total width.
### Detailed Analysis
#### (a) PM Heatmap
- **Top-left quadrant** (x: -0.4 to 0.0, y: 0.0 to 0.4): Dominated by dark red cells, indicating normalized errors near 0.8–1.0.
- **Bottom-left quadrant** (x: -0.4 to 0.0, y: -0.4 to 0.0): Mixed red and orange cells, with errors ranging from 0.4–0.8.
- **Top-right quadrant** (x: 0.0 to 0.4, y: 0.0 to 0.4): Gradual transition from orange to light yellow, errors ~0.2–0.6.
- **Bottom-right quadrant** (x: 0.0 to 0.4, y: -0.4 to 0.0): Predominantly light yellow, errors ~0.0–0.4.
#### (b) Proposed Heatmap
- **Uniform distribution**: Most cells are light yellow, with errors clustered near 0.0–0.2.
- **Top-left quadrant**: Slightly darker yellow cells (errors ~0.2–0.4) compared to the rest.
- **No dark red regions**: No areas exceed 0.4 normalized error.
### Key Observations
1. The PM method exhibits significant spatial variability in error, with high errors concentrated in the top-left and bottom-left quadrants.
2. The Proposed method shows a drastic reduction in error magnitude, with nearly uniform low errors across the grid.
3. The top-left quadrant of the PM heatmap contains the highest errors (~0.8–1.0), while the Proposed method reduces these to ~0.2–0.4.
### Interpretation
The Proposed method demonstrates a consistent improvement in error reduction compared to the PM baseline. The PM method’s high errors in specific quadrants suggest systematic biases or limitations in handling certain spatial regions. The Proposed method’s uniformity implies a more robust or adaptive approach, potentially addressing the PM method’s weaknesses. The absence of dark red regions in the Proposed heatmap indicates a significant performance gain, particularly in error-prone areas. This suggests the Proposed method may be more reliable for applications requiring precise spatial error control.