TECHNICAL ASSET FINGERPRINT
35c8a4e22bcc0ab477b34bb3
Click to view fullscreen
Press ESC or click to close
FOUND IN PAPERS
EXPERT: healer-alpha-free VERSION 1
RUNTIME: free/openrouter/healer-alpha
INTEL_VERIFIED
## Diagram: AI Image Attribute Extraction Pipeline and Performance Analysis
### Overview
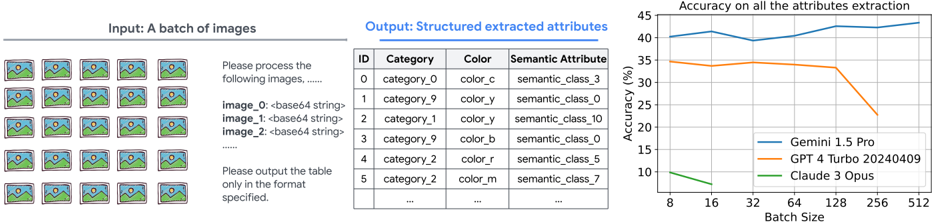
The image is a composite diagram illustrating a technical process and its results. It is divided into three distinct sections from left to right: an input batch of images, a structured output table, and a performance chart. The overall theme is the automated extraction of structured attributes (category, color, semantic class) from a batch of images using different AI models, and a comparison of their accuracy.
### Components/Axes
The image is segmented into three primary regions:
1. **Left Region (Input):**
* **Header:** "Input: A batch of images"
* **Visual:** A 4x6 grid (24 total) of identical thumbnail images. Each thumbnail depicts a stylized landscape with a green hill, blue sky, and a yellow sun/moon.
* **Text Prompt:** Below the grid, a text block reads:
```
Please process the following images. .....
image_0:<base64 string>
image_1:<base64 string>
image_2:<base64 string>
.....
Please output the table only in the format specified.
```
2. **Middle Region (Output):**
* **Header:** "Output: Structured extracted attributes"
* **Table:** A data table with four columns and seven visible rows (including header).
| ID | Category | Color | Semantic Attribute |
|----|----------|-------|---------------------|
| 0 | category_0 | color_c | semantic_class_3 |
| 1 | category_9 | color_y | semantic_class_0 |
| 2 | category_1 | color_y | semantic_class_10 |
| 3 | category_9 | color_b | semantic_class_0 |
| 4 | category_2 | color_r | semantic_class_5 |
| 5 | category_2 | color_m | semantic_class_7 |
| ... | ... | ... | ... |
3. **Right Region (Chart):**
* **Chart Title:** "Accuracy on all the attributes extraction"
* **Y-Axis:** Label: `Accuracy (%)`. Scale: 0 to 45, with major ticks at 0, 5, 10, 15, 20, 25, 30, 35, 40, 45.
* **X-Axis:** Label: `Batch Size`. Scale: Logarithmic or categorical with values: 8, 16, 32, 64, 128, 256, 512.
* **Legend:** Positioned in the bottom-right corner of the chart area.
* Blue Line: `Gemini 1.5 Pro`
* Orange Line: `GPT 4 Turbo 20240409`
* Green Line: `Claude 3 Opus`
### Detailed Analysis
* **Input Process:** The diagram shows a batch processing workflow where multiple images (represented as base64 strings) are sent to an AI model with a specific instruction to output a structured table.
* **Output Table Structure:** The sample output table demonstrates the expected schema. The attributes (`category_0`, `color_c`, etc.) appear to be categorical labels rather than descriptive words. The pattern suggests the model is classifying images into predefined taxonomies.
* **Performance Chart Data Points (Approximate):**
* **Gemini 1.5 Pro (Blue Line):** Trend is generally upward with a slight dip at batch size 32.
* Batch 8: ~40%
* Batch 16: ~42%
* Batch 32: ~39%
* Batch 64: ~42%
* Batch 128: ~43%
* Batch 256: ~44%
* Batch 512: ~44%
* **GPT 4 Turbo 20240409 (Orange Line):** Trend is stable initially, then declines sharply after batch size 128.
* Batch 8: ~35%
* Batch 16: ~34%
* Batch 32: ~34%
* Batch 64: ~34%
* Batch 128: ~33%
* Batch 256: ~25%
* Batch 512: ~23%
* **Claude 3 Opus (Green Line):** Trend is consistently low and slightly declining.
* Batch 8: ~10%
* Batch 16: ~9%
* Batch 32: ~8%
* Batch 64: ~7%
* Batch 128: ~6%
* Batch 256: ~5%
* Batch 512: ~4%
### Key Observations
1. **Model Performance Hierarchy:** There is a clear and significant performance gap between the models on this specific task. Gemini 1.5 Pro consistently outperforms the others, maintaining accuracy above 39%. GPT-4 Turbo is in the mid-range but shows a critical failure point at larger batch sizes. Claude 3 Opus performs poorly throughout.
2. **Batch Size Sensitivity:** The models exhibit different sensitivities to batch size.
* Gemini's accuracy is robust and even improves slightly with larger batches.
* GPT-4 Turbo's performance is stable up to a batch size of 128, after which it degrades rapidly (a drop of ~10 percentage points from batch 128 to 256).
* Claude 3 Opus shows a slow, steady decline as batch size increases.
3. **Task Specificity:** The task—extracting structured categorical attributes from images—appears to be one where Gemini has a distinct advantage based on this data.
### Interpretation
This diagram presents a benchmark or evaluation result for multi-modal AI models on a specific image understanding task: structured attribute extraction. The pipeline (input batch -> model -> structured output) is a common pattern in data annotation, content moderation, or database population workflows.
The data suggests that for this particular task, **Gemini 1.5 Pro is the most suitable and scalable choice**, as it not only has the highest baseline accuracy but also handles increased workload (larger batch sizes) effectively, possibly indicating better optimization for parallel processing or more consistent inference.
The sharp decline in **GPT-4 Turbo's** accuracy beyond a batch size of 128 is a critical finding. This could point to a technical limitation in its API or model architecture when handling very large concurrent requests, such as context window constraints, rate limiting, or a drop in per-item attention quality. It implies a practical upper limit for efficient batch processing with this model on this task.
The consistently low performance of **Claude 3 Opus** suggests it may not be well-suited for this type of fine-grained, categorical visual attribute extraction, or that the task's specific label set (`category_0`, `color_c`, etc.) is misaligned with its training or prompting configuration.
In a Peircean sense, the chart is an indexical sign pointing to the models' underlying capabilities and constraints. The iconic representation (the lines) correlates directly with performance, and the symbolic labels (model names, axes) allow us to interpret this as a comparative analysis. The anomaly of GPT-4's drop-off is a key signifier of a potential system boundary or failure mode.
DECODING INTELLIGENCE...