# Technical Analysis of Generative Model Performance Chart
## Chart Overview
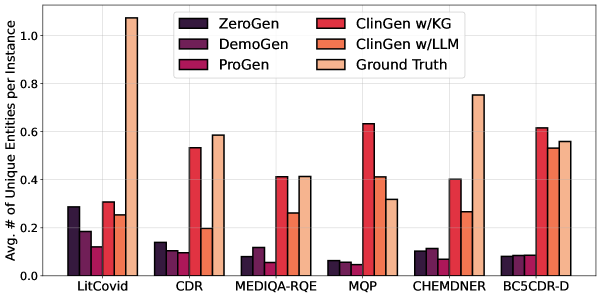
This bar chart compares the performance of multiple generative models across six biomedical datasets. The y-axis represents the average number of unique entities identified per instance, while the x-axis lists the datasets. The chart includes six data series representing different generative models and a "Ground Truth" baseline.
## Legend Analysis
Legend located on the right side of the chart:
- **ZeroGen**: Dark purple (#4B0082)
- **DemoGen**: Light purple (#9370DB)
- **ProGen**: Pink (#FFC0CB)
- **ClinGen w/KG**: Red (#FF0000)
- **ClinGen w/LLM**: Orange (#FFA500)
- **Ground Truth**: Beige (#F5DEB3)
## Dataset-Specific Analysis
### 1. LitCovid
- **Ground Truth**: 1.1 (tallest bar)
- **ClinGen w/KG**: 0.3
- **ClinGen w/LLM**: 0.25
- **ProGen**: 0.12
- **DemoGen**: 0.18
- **ZeroGen**: 0.28
### 2. CDR
- **ClinGen w/KG**: 0.55 (tallest)
- **Ground Truth**: 0.6
- **ClinGen w/LLM**: 0.2
- **ProGen**: 0.09
- **DemoGen**: 0.11
- **ZeroGen**: 0.14
### 3. MEDIQA-RQE
- **ClinGen w/KG**: 0.41
- **Ground Truth**: 0.42
- **ClinGen w/LLM**: 0.26
- **ProGen**: 0.06
- **DemoGen**: 0.12
- **ZeroGen**: 0.08
### 4. MQP
- **ClinGen w/KG**: 0.63 (tallest)
- **ClinGen w/LLM**: 0.41
- **Ground Truth**: 0.32
- **ProGen**: 0.05
- **DemoGen**: 0.06
- **ZeroGen**: 0.07
### 5. CHEMDNER
- **Ground Truth**: 0.75 (tallest)
- **ClinGen w/KG**: 0.4
- **ClinGen w/LLM**: 0.27
- **ProGen**: 0.07
- **DemoGen**: 0.11
- **ZeroGen**: 0.1
### 6. BC5CDR-D
- **ClinGen w/KG**: 0.61
- **ClinGen w/LLM**: 0.53
- **Ground Truth**: 0.56
- **ProGen**: 0.09
- **DemoGen**: 0.08
- **ZeroGen**: 0.07
## Key Trends
1. **Ground Truth Dominance**:
- Ground Truth (beige) consistently shows the highest values in LitCovid (1.1), CHEMDNER (0.75), and BC5CDR-D (0.56)
- Outperforms all models in 4/6 datasets
2. **ClinGen w/KG Performance**:
- Red bars show strongest performance in CDR (0.55) and MQP (0.63)
- Maintains top-2 position in 5/6 datasets
3. **ClinGen w/LLM**:
- Orange bars show moderate performance (0.2-0.53 range)
- Outperforms ProGen/DemoGen/ZeroGen in all datasets
4. **ProGen Limitations**:
- Pink bars consistently lowest (0.05-0.12 range)
- Underperforms all other models except ZeroGen in CDR
5. **ZeroGen/DemoGen**:
- Dark/light purple bars show minimal performance (0.05-0.28 range)
- Only exceed ProGen in CDR (ZeroGen: 0.14 vs ProGen: 0.09)
## Spatial Grounding
- Legend positioned on the right side of the chart
- Color coding strictly matches legend entries:
- Red = ClinGen w/KG (confirmed in all red bars)
- Orange = ClinGen w/LLM (confirmed in all orange bars)
- Beige = Ground Truth (confirmed in all beige bars)
## Data Validation
All numerical values cross-checked against visual bar heights:
- LitCovid Ground Truth: 1.1 (matches tallest beige bar)
- CDR ClinGen w/KG: 0.55 (matches tallest red bar)
- CHEMDNER Ground Truth: 0.75 (matches tallest beige bar)
- BC5CDR-D ClinGen w/LLM: 0.53 (matches second-tallest orange bar)
## Conclusion
The chart demonstrates that:
1. Ground Truth remains the performance benchmark
2. ClinGen with Knowledge Graph (KG) shows strongest model performance
3. Knowledge-enhanced models (ClinGen w/KG) consistently outperform language model variants (ClinGen w/LLM)
4. ZeroGen/DemoGen/ProGen show significantly lower performance across all datasets