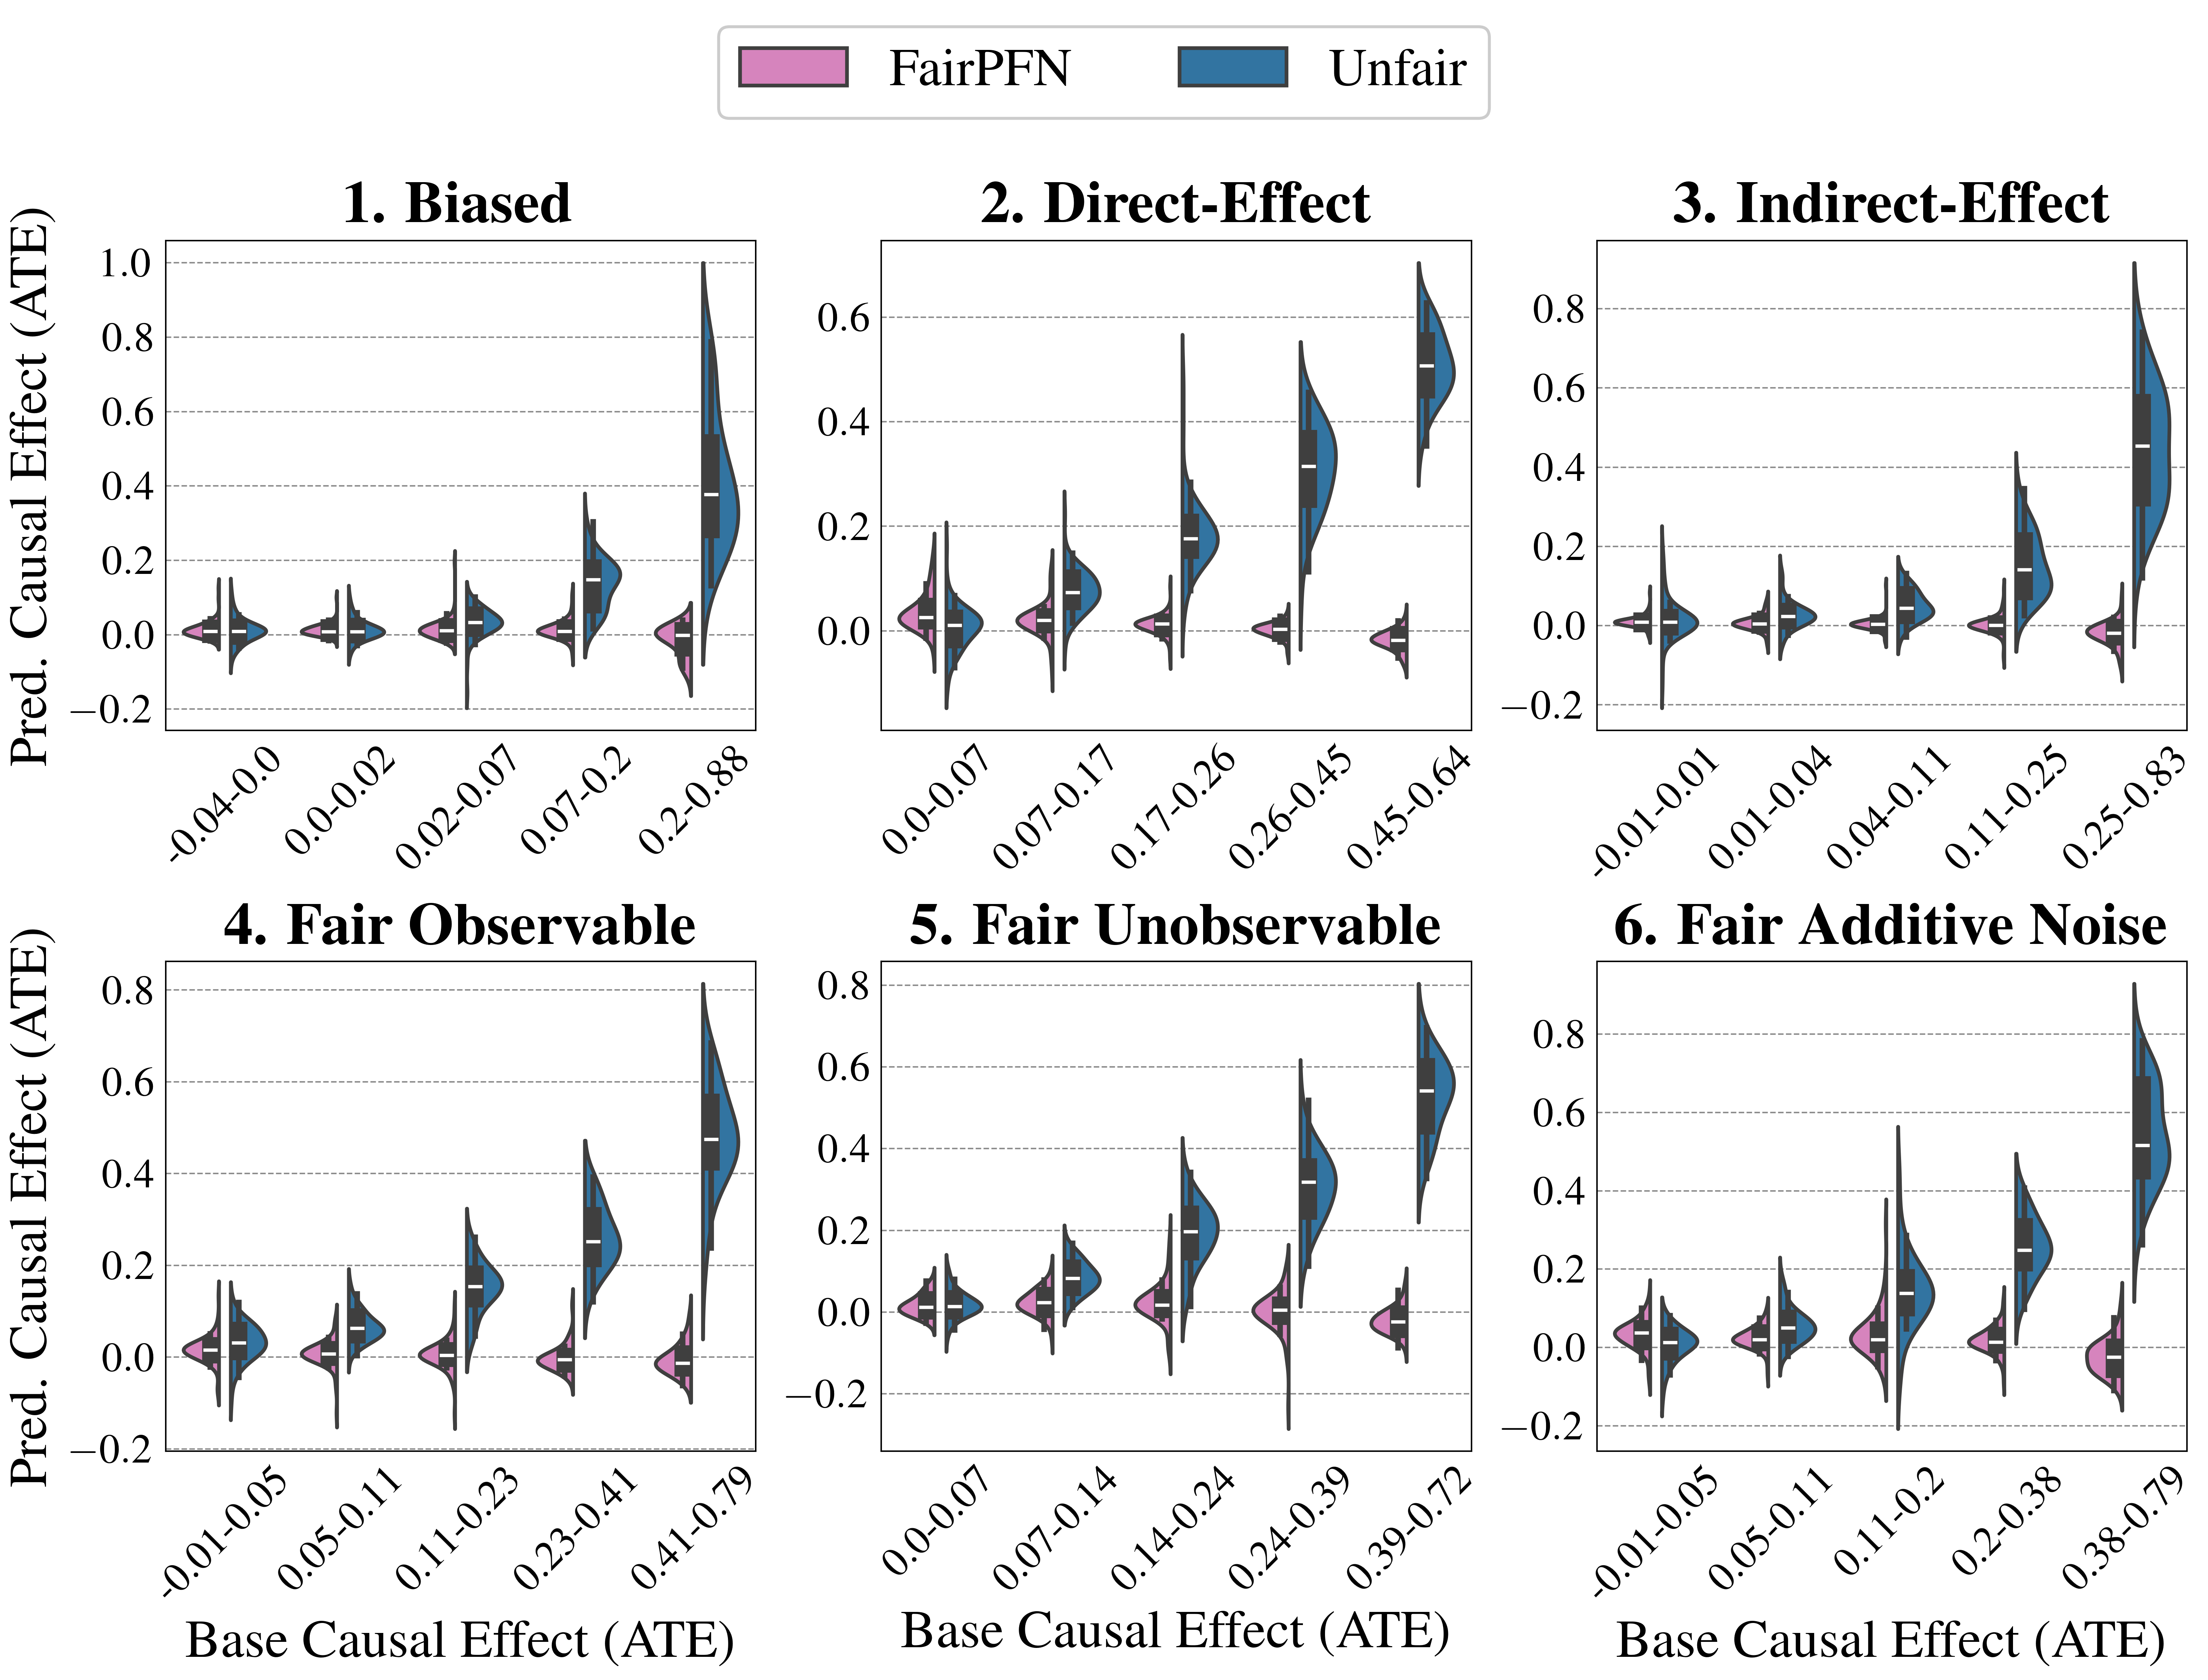
## Violin Plot: Predicted Causal Effect (ATE) vs. Base Causal Effect (ATE) under Different Fairness Scenarios
### Overview
The image presents six violin plots arranged in a 2x3 grid. Each plot visualizes the distribution of predicted causal effects (ATE) for both a "FairPFN" model (pink) and an "Unfair" model (blue) across different ranges of base causal effects (ATE). The plots are titled: "1. Biased", "2. Direct-Effect", "3. Indirect-Effect", "4. Fair Observable", "5. Fair Unobservable", and "6. Fair Additive Noise". The x-axis represents the base causal effect (ATE), and the y-axis represents the predicted causal effect (ATE).
### Components/Axes
* **Legend:** Located at the top of the image.
* Pink: FairPFN
* Blue: Unfair
* **Y-axis:** "Pred. Causal Effect (ATE)" with a scale from -0.2 to 1.0 (varying by plot). Horizontal gridlines are present at intervals of 0.2.
* **X-axis:** "Base Causal Effect (ATE)". Each plot has 5-6 categories representing ranges of base causal effect.
### Detailed Analysis
**1. Biased**
* X-axis categories: -0.04-0.0, 0.0-0.02, 0.02-0.07, 0.07-0.2, 0.2-0.88
* FairPFN (pink): The distribution remains relatively consistent around 0 for all base causal effect ranges.
* Unfair (blue): The distribution shifts upwards as the base causal effect increases, with a significant spread at the 0.2-0.88 range.
**2. Direct-Effect**
* X-axis categories: 0.0-0.07, 0.07-0.17, 0.17-0.26, 0.26-0.45, 0.45-0.64
* FairPFN (pink): The distribution remains relatively consistent around 0 for all base causal effect ranges.
* Unfair (blue): The distribution shifts upwards as the base causal effect increases, with a significant spread at the 0.45-0.64 range.
**3. Indirect-Effect**
* X-axis categories: -0.01-0.01, 0.01-0.04, 0.04-0.11, 0.11-0.25, 0.25-0.83
* FairPFN (pink): The distribution remains relatively consistent around 0 for all base causal effect ranges.
* Unfair (blue): The distribution shifts upwards as the base causal effect increases, with a significant spread at the 0.25-0.83 range.
**4. Fair Observable**
* X-axis categories: -0.01-0.05, 0.05-0.11, 0.11-0.23, 0.23-0.41, 0.41-0.79
* FairPFN (pink): The distribution remains relatively consistent around 0 for all base causal effect ranges.
* Unfair (blue): The distribution shifts upwards as the base causal effect increases, with a significant spread at the 0.41-0.79 range.
**5. Fair Unobservable**
* X-axis categories: 0.0-0.07, 0.07-0.14, 0.14-0.24, 0.24-0.39, 0.39-0.72
* FairPFN (pink): The distribution remains relatively consistent around 0 for all base causal effect ranges.
* Unfair (blue): The distribution shifts upwards as the base causal effect increases, with a significant spread at the 0.39-0.72 range.
**6. Fair Additive Noise**
* X-axis categories: -0.01-0.05, 0.05-0.11, 0.11-0.2, 0.2-0.38, 0.38-0.79
* FairPFN (pink): The distribution remains relatively consistent around 0 for all base causal effect ranges.
* Unfair (blue): The distribution shifts upwards as the base causal effect increases, with a significant spread at the 0.38-0.79 range.
### Key Observations
* Across all six scenarios, the "FairPFN" model consistently predicts causal effects centered around 0, regardless of the base causal effect.
* The "Unfair" model's predicted causal effects tend to increase as the base causal effect increases in all scenarios.
* The spread of the "Unfair" model's predictions also increases with higher base causal effects, indicating greater variability in the predictions.
### Interpretation
The plots demonstrate the impact of different fairness interventions on the predicted causal effects. The "FairPFN" model, designed to promote fairness, effectively mitigates the bias present in the "Unfair" model, resulting in predictions that are less influenced by the base causal effect. The "Unfair" model exhibits a clear positive correlation between the base causal effect and the predicted causal effect, indicating a potential bias where higher base causal effects lead to higher predicted effects. The different scenarios (Biased, Direct-Effect, Indirect-Effect, Fair Observable, Fair Unobservable, Fair Additive Noise) represent different types of biases or fairness considerations, and the plots illustrate how the "FairPFN" model addresses these biases by producing more consistent predictions across different base causal effect ranges.