## Violin Plot Grid: Predicted vs. Base Causal Effects Across Fairness Scenarios
### Overview
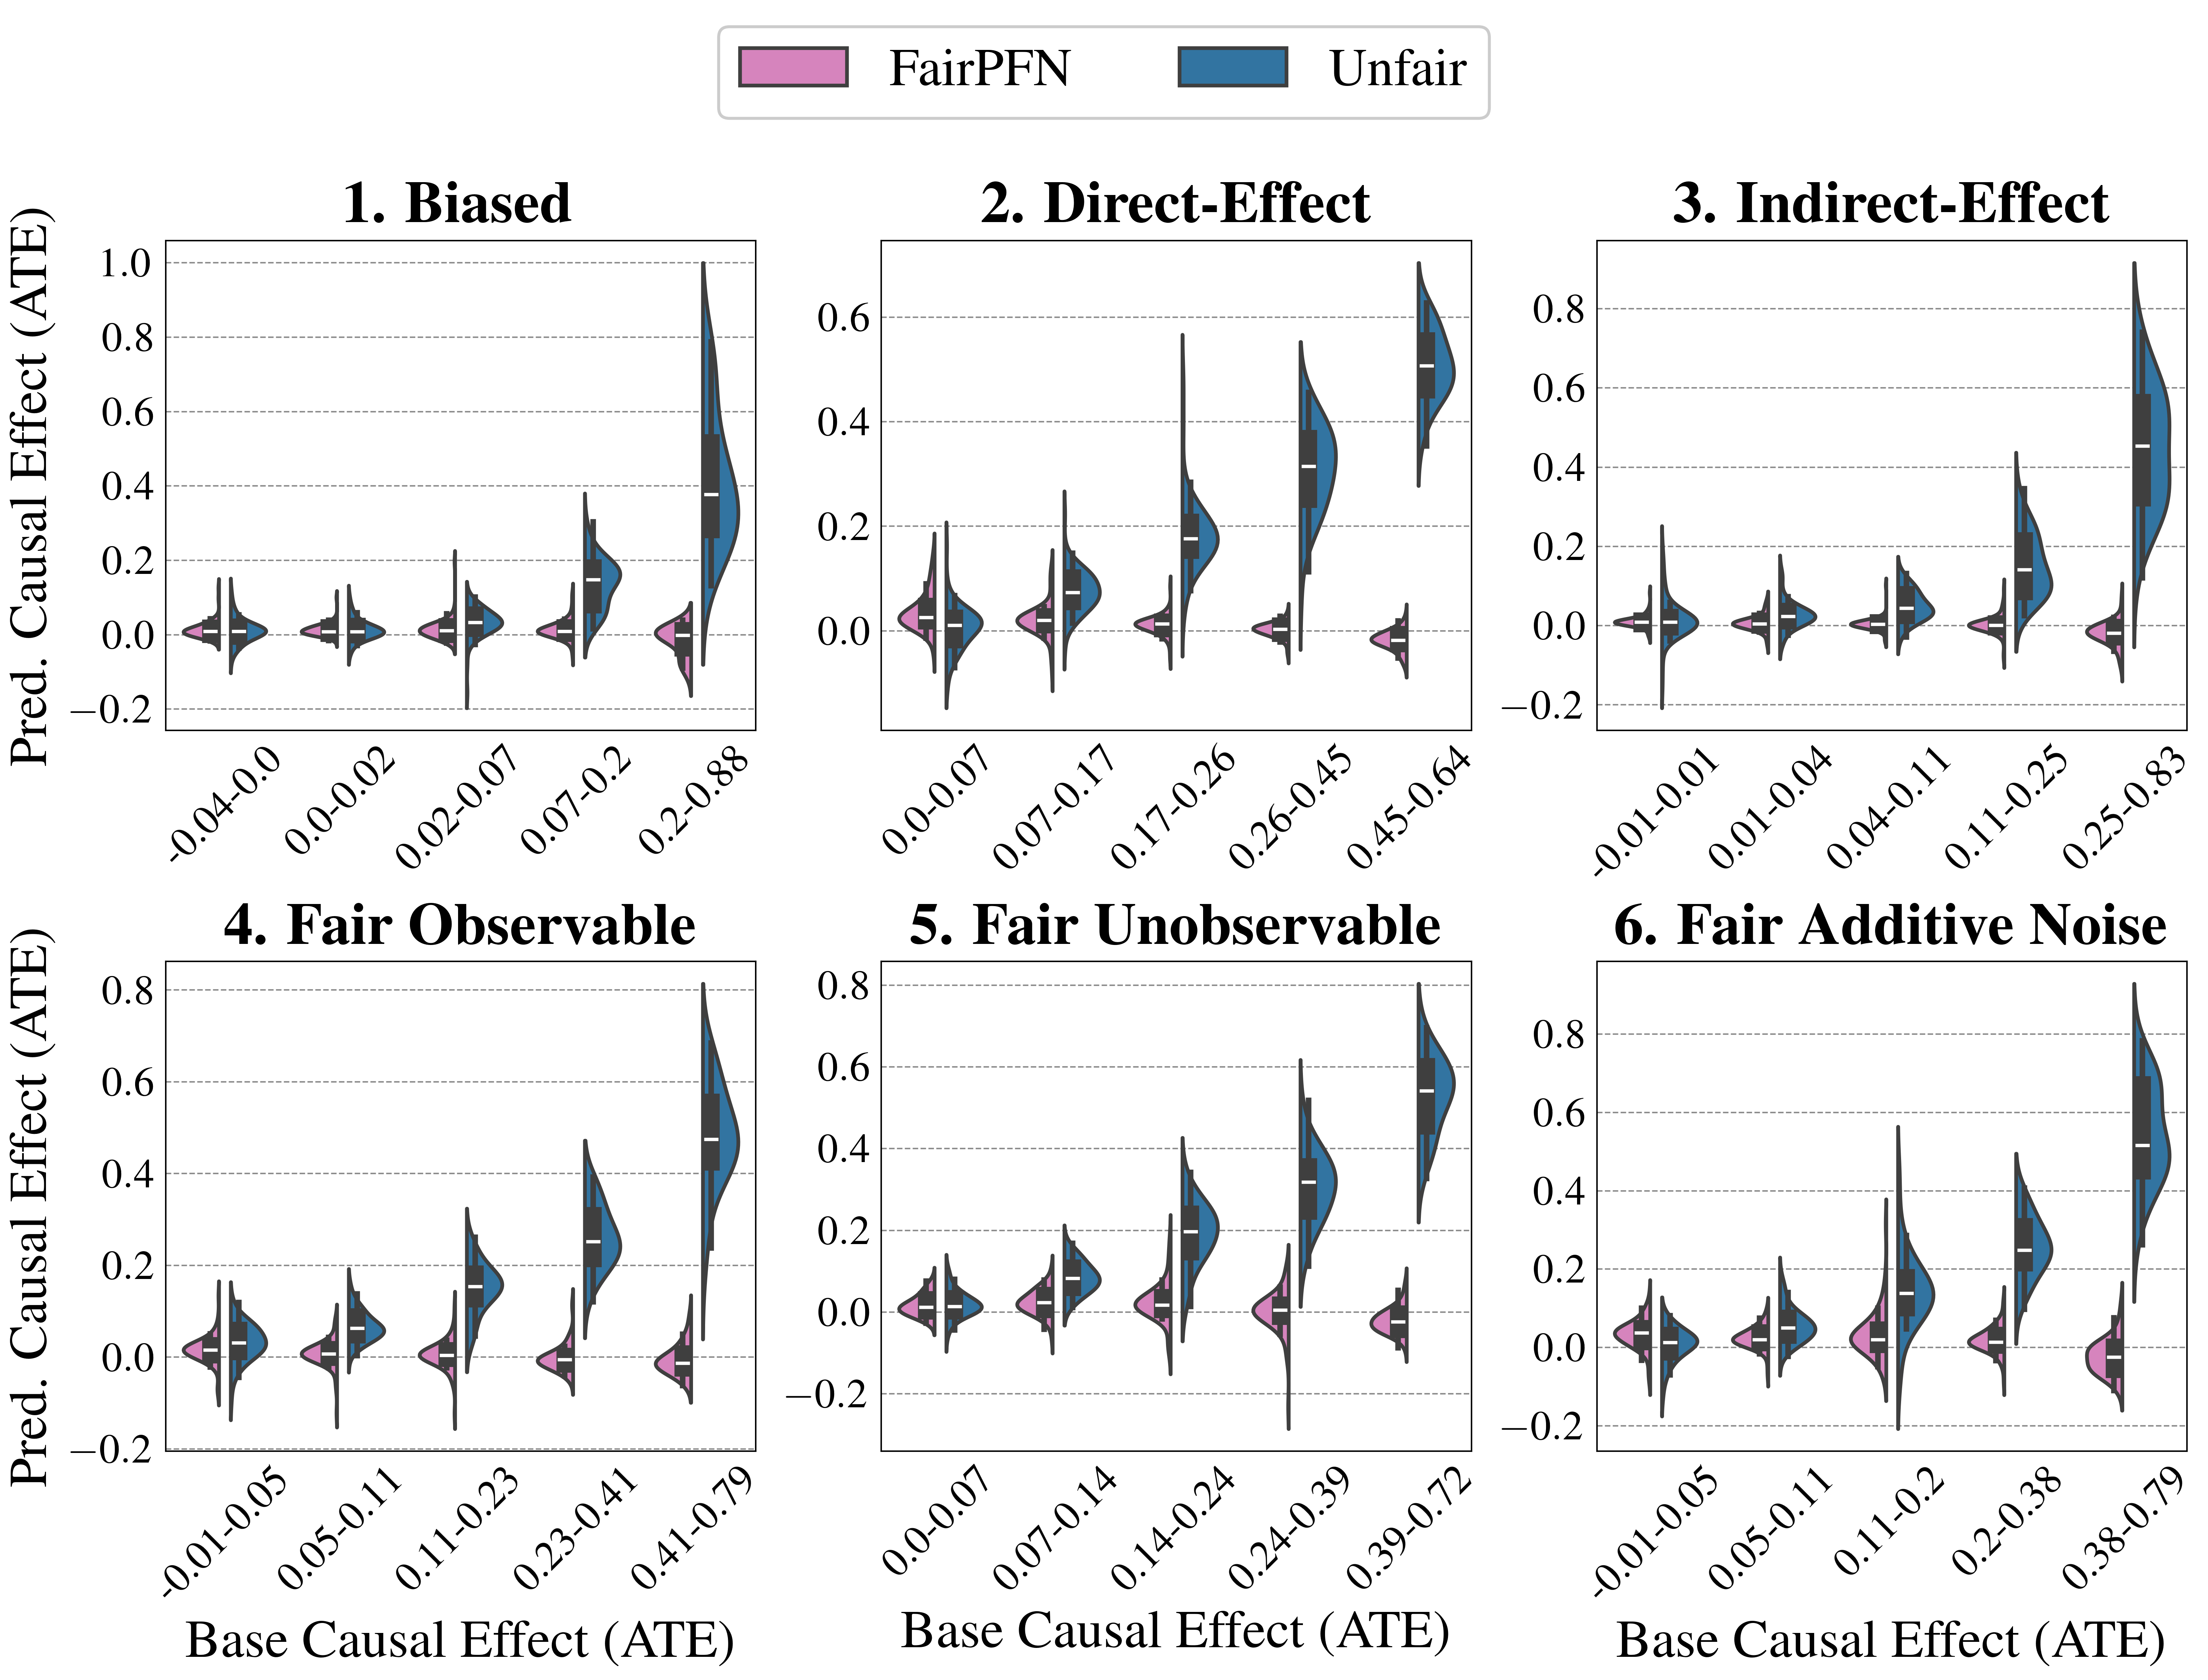
The image displays a 2x3 grid of violin plots comparing predicted causal effects (y-axis) to base causal effects (x-axis) across six fairness scenarios. Each plot uses two colors: pink for "FairPFN" and blue for "Unfair," with medians marked by black lines and quartiles by black boxes. The x-axis ranges vary per plot, while the y-axis consistently spans -0.2 to 1.0.
---
### Components/Axes
- **Legend**: Top center, labeled "FairPFN" (pink) and "Unfair" (blue).
- **X-Axes**: Labeled "Base Causal Effect (ATE)" with scenario-specific ranges:
- 1. Biased: -0.04–0.88
- 2. Direct-Effect: 0.00–0.64
- 3. Indirect-Effect: -0.01–0.83
- 4. Fair Observable: -0.01–0.79
- 5. Fair Unobservable: 0.00–0.72
- 6. Fair Additive Noise: -0.01–0.79
- **Y-Axes**: Labeled "Pred. Causal Effect (ATE)" with uniform scale (-0.2 to 1.0).
- **Plot Titles**: Bold black text above each plot (e.g., "1. Biased," "6. Fair Additive Noise").
---
### Detailed Analysis
#### 1. Biased
- **X-Axis**: -0.04–0.88 (widest range).
- **Y-Axis**: Distributions show significant overlap.
- **FairPFN (pink)**: Narrower spread, median ~0.0–0.2.
- **Unfair (blue)**: Broader spread, median ~0.2–0.4, with outliers up to 0.8.
- **Trend**: Unfair predictions exhibit higher variability and larger magnitudes.
#### 2. Direct-Effect
- **X-Axis**: 0.00–0.64.
- **Y-Axis**:
- **FairPFN**: Median ~0.1–0.3, compact distribution.
- **Unfair**: Median ~0.2–0.4, wider spread with peaks near 0.6.
- **Trend**: Unfair predictions align closer to higher base effects.
#### 3. Indirect-Effect
- **X-Axis**: -0.01–0.83.
- **Y-Axis**:
- **FairPFN**: Median ~0.0–0.2, tightly clustered.
- **Unfair**: Median ~0.3–0.5, extended spread to 0.8.
- **Trend**: Unfair predictions show stronger positive bias.
#### 4. Fair Observable
- **X-Axis**: -0.01–0.79.
- **Y-Axis**:
- **FairPFN**: Median ~0.0–0.2, minimal spread.
- **Unfair**: Median ~0.1–0.3, slightly wider distribution.
- **Trend**: Both groups cluster near zero, but Unfair shows marginal deviation.
#### 5. Fair Unobservable
- **X-Axis**: 0.00–0.72.
- **Y-Axis**:
- **FairPFN**: Median ~0.0–0.2, compact.
- **Unfair**: Median ~0.1–0.3, moderate spread.
- **Trend**: Similar to plot 4, but Unfair predictions show slightly higher central tendency.
#### 6. Fair Additive Noise
- **X-Axis**: -0.01–0.79.
- **Y-Axis**:
- **FairPFN**: Median ~0.0–0.2, narrow distribution.
- **Unfair**: Median ~0.2–0.4, extended spread to 0.8.
- **Trend**: Unfair predictions exhibit pronounced positive bias, especially at higher base effects.
---
### Key Observations
1. **Bias Amplification**: In scenarios labeled "Biased" and "Indirect-Effect," Unfair predictions consistently show higher medians and wider spreads than FairPFN, suggesting model amplification of bias.
2. **Fairness Scenarios**:
- "Fair Observable" and "Fair Unobservable" plots show minimal divergence, indicating robustness in controlled fairness conditions.
- "Fair Additive Noise" reveals significant Unfair bias, implying sensitivity to noise injection.
3. **Outliers**: Unfair distributions in plots 1, 3, and 6 include extreme values (up to 0.8), absent in FairPFN.
---
### Interpretation
The data demonstrates that fairness-aware models (FairPFN) generally produce more stable and unbiased predictions across scenarios compared to Unfair models. However, Unfair models exhibit:
- **Bias Amplification**: Larger predicted effects in biased or indirect-effect scenarios.
- **Noise Sensitivity**: Increased deviation in "Fair Additive Noise," suggesting vulnerability to input perturbations.
- **Robustness**: FairPFN maintains consistency in observable/unobservable fairness conditions, highlighting its design efficacy.
These trends underscore the importance of fairness constraints in causal modeling, particularly in high-stakes applications where biased predictions could exacerbate disparities.