## Line Chart: Accuracy vs. Unique Training Samples for Different Loop Families
### Overview
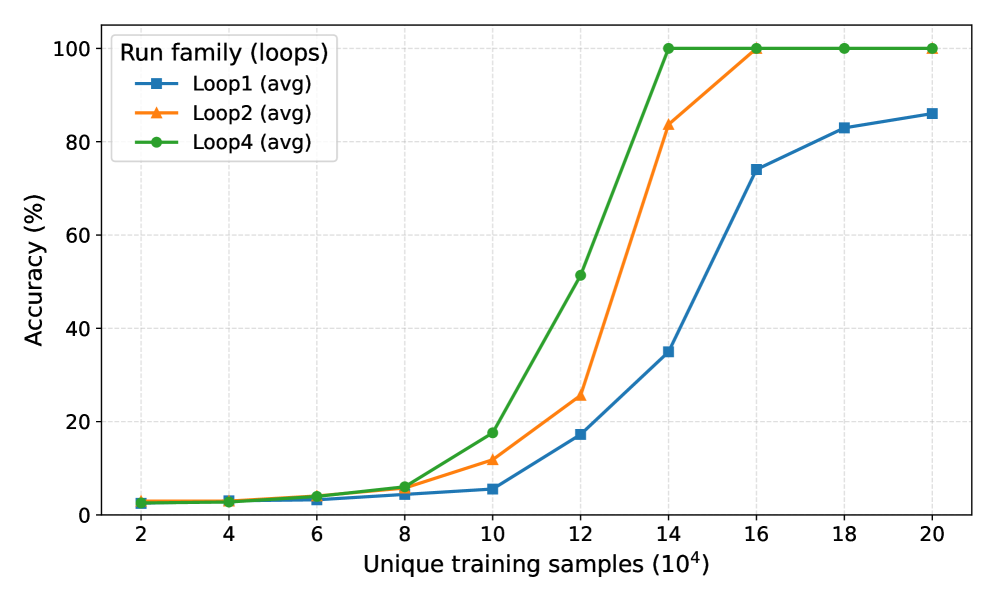
The image is a line chart comparing the accuracy of three different loop families (Loop1, Loop2, and Loop4) as a function of the number of unique training samples. The x-axis represents the number of unique training samples (in units of 10^4), and the y-axis represents the accuracy in percentage.
### Components/Axes
* **Title:** Run family (loops)
* **X-axis:** Unique training samples (10^4)
* **X-axis Markers:** 2, 4, 6, 8, 10, 12, 14, 16, 18, 20
* **Y-axis:** Accuracy (%)
* **Y-axis Markers:** 0, 20, 40, 60, 80, 100
* **Legend:** Located in the top-left corner.
* **Loop1 (avg):** Blue line with square markers.
* **Loop2 (avg):** Orange line with triangle markers.
* **Loop4 (avg):** Green line with circle markers.
### Detailed Analysis
* **Loop1 (avg) - Blue Line:**
* Trend: The accuracy increases with the number of training samples. It starts relatively flat and then increases sharply after 12x10^4 samples.
* Data Points:
* 2x10^4 samples: ~2% accuracy
* 4x10^4 samples: ~2% accuracy
* 6x10^4 samples: ~3% accuracy
* 8x10^4 samples: ~4% accuracy
* 10x10^4 samples: ~7% accuracy
* 12x10^4 samples: ~17% accuracy
* 14x10^4 samples: ~35% accuracy
* 16x10^4 samples: ~74% accuracy
* 18x10^4 samples: ~83% accuracy
* 20x10^4 samples: ~86% accuracy
* **Loop2 (avg) - Orange Line:**
* Trend: The accuracy increases with the number of training samples. It increases sharply between 10x10^4 and 14x10^4 samples.
* Data Points:
* 2x10^4 samples: ~2% accuracy
* 4x10^4 samples: ~2% accuracy
* 6x10^4 samples: ~3% accuracy
* 8x10^4 samples: ~4% accuracy
* 10x10^4 samples: ~11% accuracy
* 12x10^4 samples: ~25% accuracy
* 14x10^4 samples: ~84% accuracy
* 16x10^4 samples: ~93% accuracy
* 18x10^4 samples: ~97% accuracy
* 20x10^4 samples: ~99% accuracy
* **Loop4 (avg) - Green Line:**
* Trend: The accuracy increases with the number of training samples. It increases sharply between 8x10^4 and 14x10^4 samples, reaching 100% accuracy at 14x10^4 samples.
* Data Points:
* 2x10^4 samples: ~2% accuracy
* 4x10^4 samples: ~2% accuracy
* 6x10^4 samples: ~3% accuracy
* 8x10^4 samples: ~5% accuracy
* 10x10^4 samples: ~17% accuracy
* 12x10^4 samples: ~52% accuracy
* 14x10^4 samples: ~100% accuracy
* 16x10^4 samples: ~100% accuracy
* 18x10^4 samples: ~100% accuracy
* 20x10^4 samples: ~100% accuracy
### Key Observations
* Loop4 achieves 100% accuracy with fewer training samples than Loop1 and Loop2.
* Loop1 has the slowest increase in accuracy as the number of training samples increases.
* All three loop families show a significant increase in accuracy between 10x10^4 and 16x10^4 training samples.
### Interpretation
The chart demonstrates the relationship between the number of unique training samples and the accuracy of different loop families. Loop4 appears to be the most efficient, achieving perfect accuracy with a relatively small number of training samples. Loop1 requires significantly more training samples to achieve comparable accuracy. The data suggests that the architecture or implementation of Loop4 is more effective at learning from the training data compared to Loop1 and Loop2. The sharp increase in accuracy for all loop families within a specific range of training samples indicates a critical threshold where the models begin to generalize effectively.