## Heatmap: Performance vs. Number of Feedback Repairs and Initial Programs
### Overview
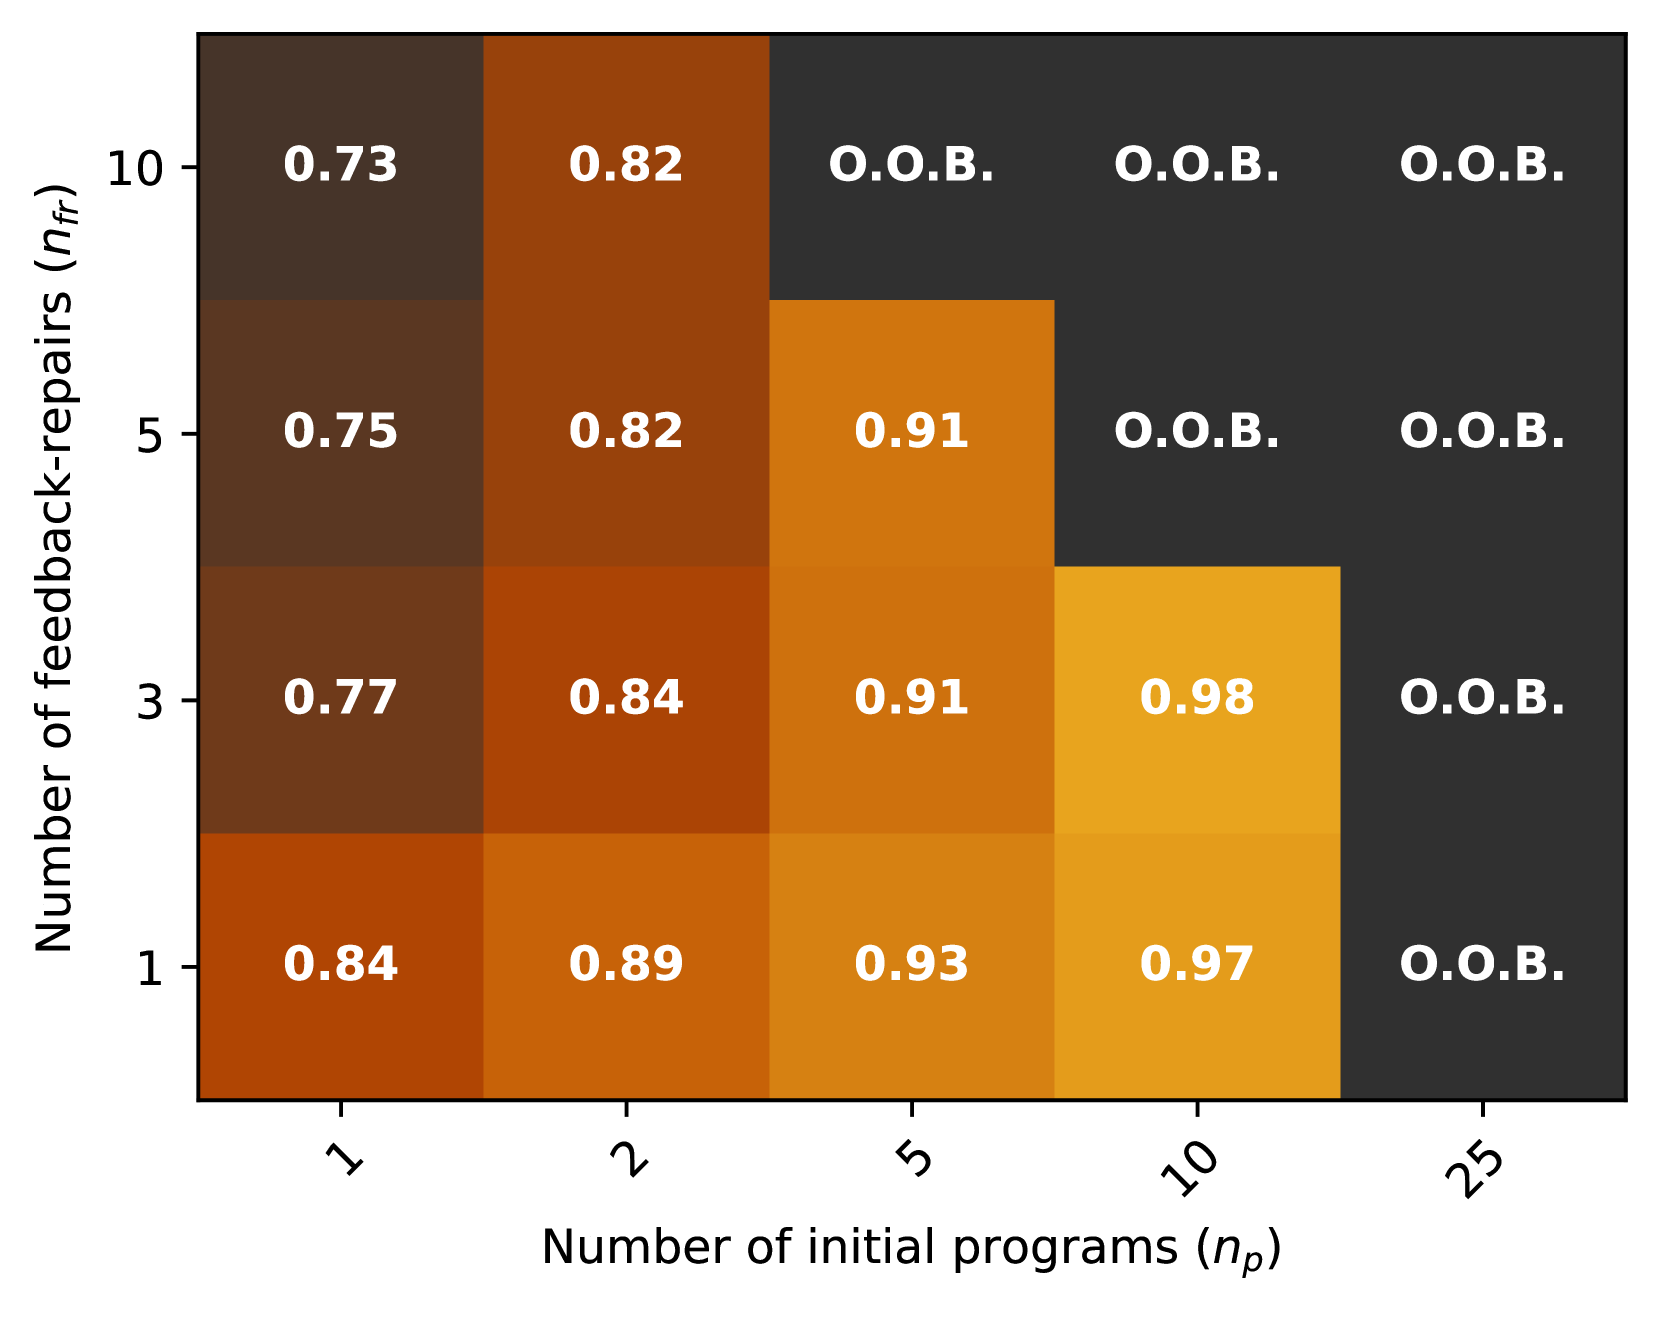
The image is a heatmap visualizing performance (represented by color intensity) as a function of two parameters: the number of feedback repairs (nfr) and the number of initial programs (np). The heatmap displays numerical values within each cell, with some cells marked as "O.O.B." (likely indicating "Out Of Bounds" or a similar constraint).
### Components/Axes
* **X-axis (Horizontal):** Number of initial programs (np). Values: 1, 2, 5, 10, 25.
* **Y-axis (Vertical):** Number of feedback-repairs (nfr). Values: 1, 3, 5, 10.
* **Color Gradient:** The color of each cell represents the performance value, with darker shades indicating lower values and lighter shades indicating higher values.
* **Cell Values:** Each cell contains a numerical value (e.g., 0.73, 0.82) or the label "O.O.B.".
### Detailed Analysis
The heatmap presents performance values for different combinations of 'Number of feedback-repairs' and 'Number of initial programs'.
Here's a breakdown of the values:
| nfr | np = 1 | np = 2 | np = 5 | np = 10 | np = 25 |
|---|---|---|---|---|---|
| 10 | 0.73 | 0.82 | O.O.B. | O.O.B. | O.O.B. |
| 5 | 0.75 | 0.82 | 0.91 | O.O.B. | O.O.B. |
| 3 | 0.77 | 0.84 | 0.91 | 0.98 | O.O.B. |
| 1 | 0.84 | 0.89 | 0.93 | 0.97 | O.O.B. |
* **Trend along X-axis (increasing np):** For a fixed number of feedback-repairs (nfr), the performance generally increases as the number of initial programs (np) increases, until it reaches "O.O.B.".
* **Trend along Y-axis (increasing nfr):** For a fixed number of initial programs (np), the performance generally decreases as the number of feedback-repairs (nfr) increases.
* **"O.O.B." Values:** All cells where np = 25 are marked as "O.O.B.". Also, cells with higher nfr and np = 5 or 10 are marked as "O.O.B.".
### Key Observations
* The highest performance values (0.97 and 0.98) are achieved with a lower number of feedback-repairs (nfr = 1 or 3) and a moderate number of initial programs (np = 10).
* Increasing the number of initial programs (np) generally improves performance, but only up to a certain point, after which the system becomes "Out Of Bounds".
* Increasing the number of feedback-repairs (nfr) generally reduces performance for a given number of initial programs.
### Interpretation
The heatmap suggests that there is an optimal balance between the number of feedback repairs and the number of initial programs. Too many feedback repairs can degrade performance, while a sufficient number of initial programs is needed to achieve good performance. The "O.O.B." values indicate that there are constraints or limitations on the system, possibly related to resource limitations or algorithmic constraints. The data suggests that the system performs best with a lower number of feedback repairs and a moderate number of initial programs, before hitting the "Out Of Bounds" condition.