\n
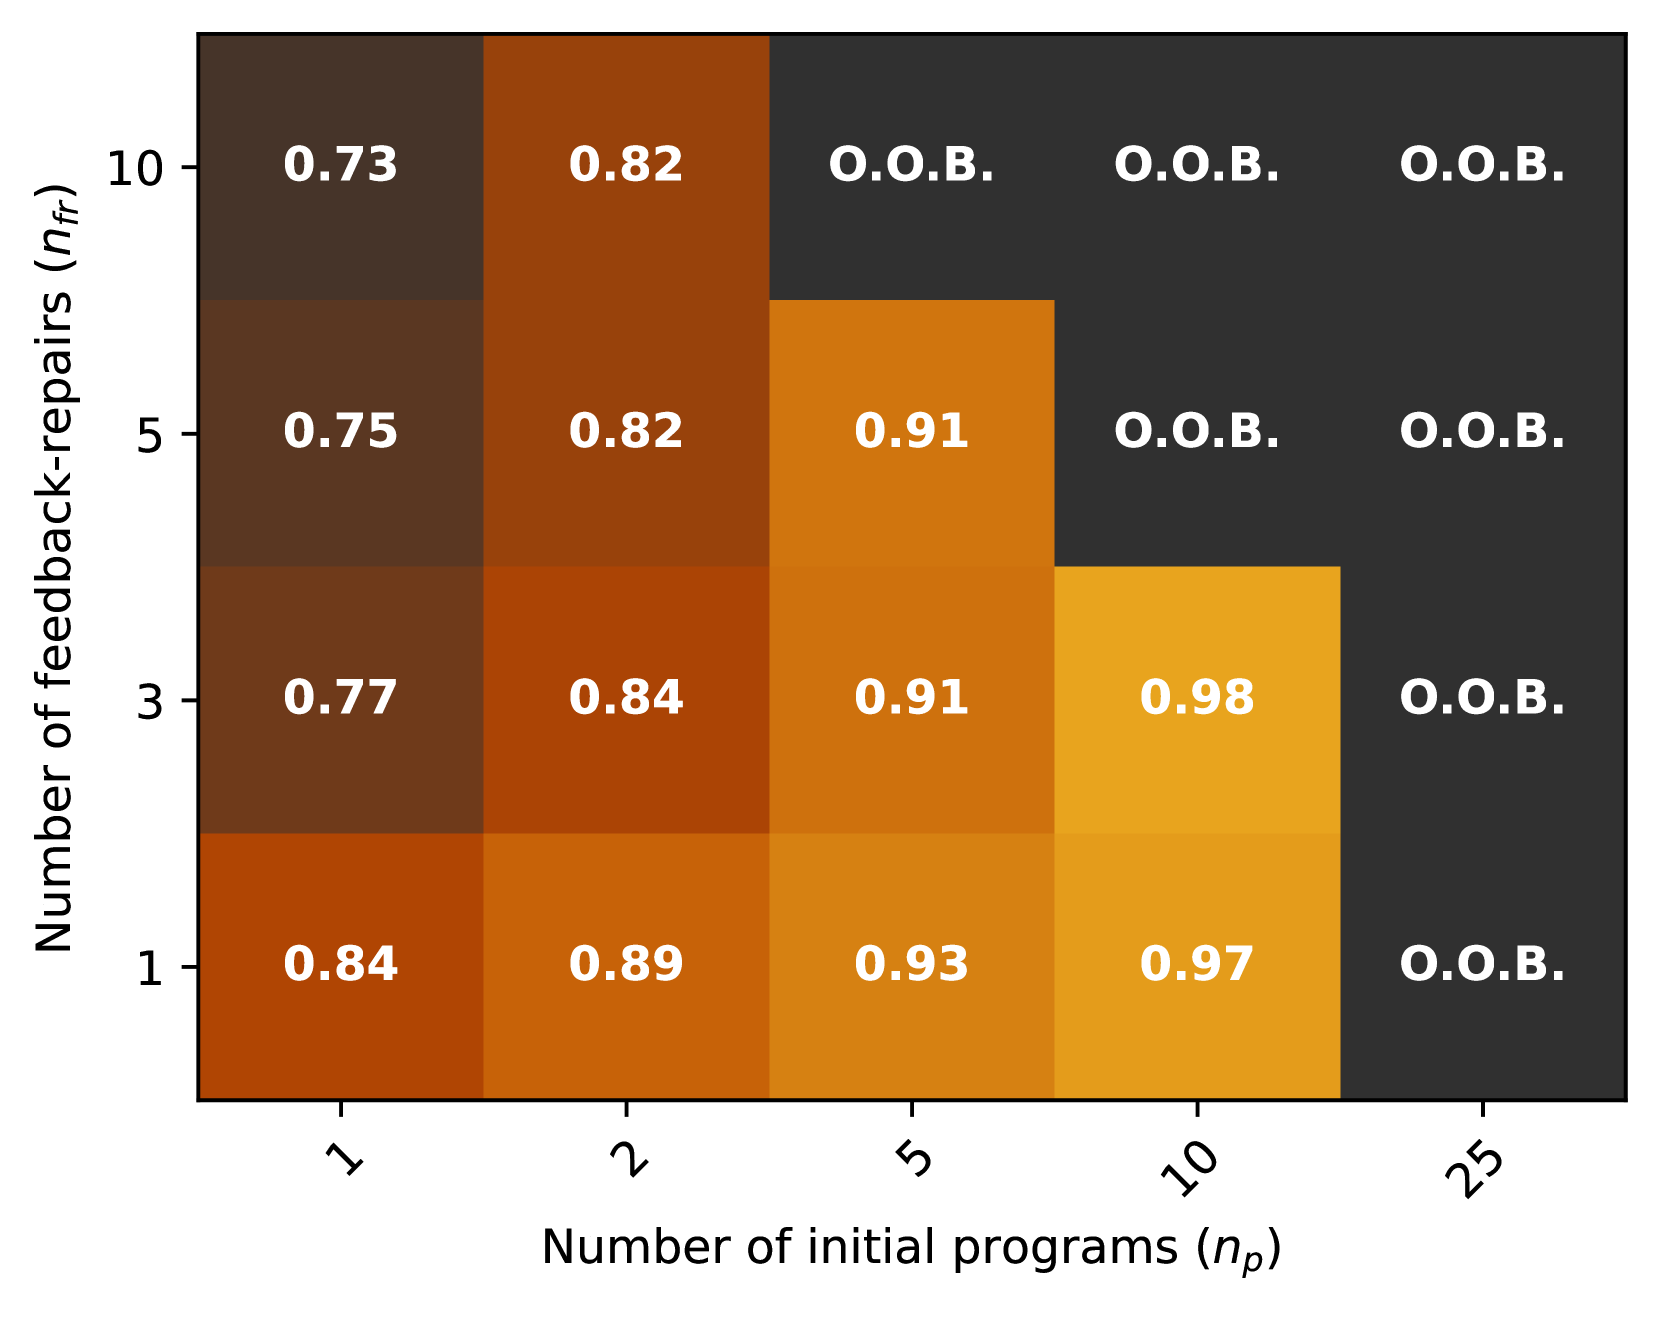
## Heatmap: Feedback-Repairs Performance
### Overview
This image presents a heatmap visualizing the performance of feedback-repairs based on the number of initial programs (np) and the number of feedback-repairs (nf). The performance is represented by numerical values ranging from approximately 0.73 to 0.98, with "O.O.B." indicating values that are "Out Of Bounds". The heatmap uses a color gradient, with darker shades representing lower values and lighter shades representing higher values.
### Components/Axes
* **X-axis:** Number of initial programs (np) with markers at 1, 2, 5, 10, and 25.
* **Y-axis:** Number of feedback-repairs (nf) with markers at 1, 3, 5, and 10.
* **Color Scale:** A gradient from dark brown to light yellow, representing performance values.
* **Data Labels:** Numerical values are displayed within each cell of the heatmap.
* **Legend:** There is no explicit legend, but the color gradient serves as an implicit legend.
### Detailed Analysis
The heatmap displays performance values for different combinations of initial programs and feedback-repairs. Here's a breakdown of the values:
* **np = 1:**
* nf = 1: 0.84
* nf = 3: 0.77
* nf = 5: 0.75
* nf = 10: 0.73
* **np = 2:**
* nf = 1: 0.89
* nf = 3: 0.84
* nf = 5: 0.82
* nf = 10: 0.82
* **np = 5:**
* nf = 1: 0.93
* nf = 3: 0.91
* nf = 5: 0.91
* nf = 10: O.O.B.
* **np = 10:**
* nf = 1: 0.97
* nf = 3: 0.98
* nf = 5: O.O.B.
* nf = 10: O.O.B.
* **np = 25:**
* nf = 1: O.O.B.
* nf = 3: O.O.B.
* nf = 5: O.O.B.
* nf = 10: O.O.B.
The values generally increase as the number of initial programs and feedback-repairs increases, up to a certain point. Beyond np = 10, all values are "O.O.B." indicating the model is out of bounds.
### Key Observations
* Performance generally improves with increasing numbers of initial programs and feedback-repairs, but this trend plateaus and then becomes undefined (O.O.B.) at higher values.
* The highest performance values (0.97 and 0.98) are achieved with np = 10 and nf = 1 and 3, respectively.
* The "O.O.B." values suggest that the model or method used to calculate performance is not valid or reliable for larger numbers of initial programs and feedback-repairs.
* The performance is relatively consistent for low values of np (1 and 2) across different values of nf.
### Interpretation
The heatmap demonstrates the relationship between the number of initial programs, the number of feedback-repairs, and the resulting performance. The data suggests that there is an optimal range for both parameters, beyond which the performance becomes unreliable or undefined. The "O.O.B." values could indicate limitations in the model's ability to generalize or handle larger datasets, or it could be a result of numerical instability. The increasing performance with more initial programs and feedback-repairs suggests that more information and refinement lead to better results, but only up to a certain point. The fact that performance plateaus and then becomes undefined suggests that there may be diminishing returns or inherent limitations in the feedback-repair process. This could be due to overfitting, saturation of the learning process, or other factors. Further investigation would be needed to understand the underlying reasons for the "O.O.B." values and to determine the optimal settings for these parameters.