## Heatmap: Performance vs. Initial Programs and Feedback Repairs
### Overview
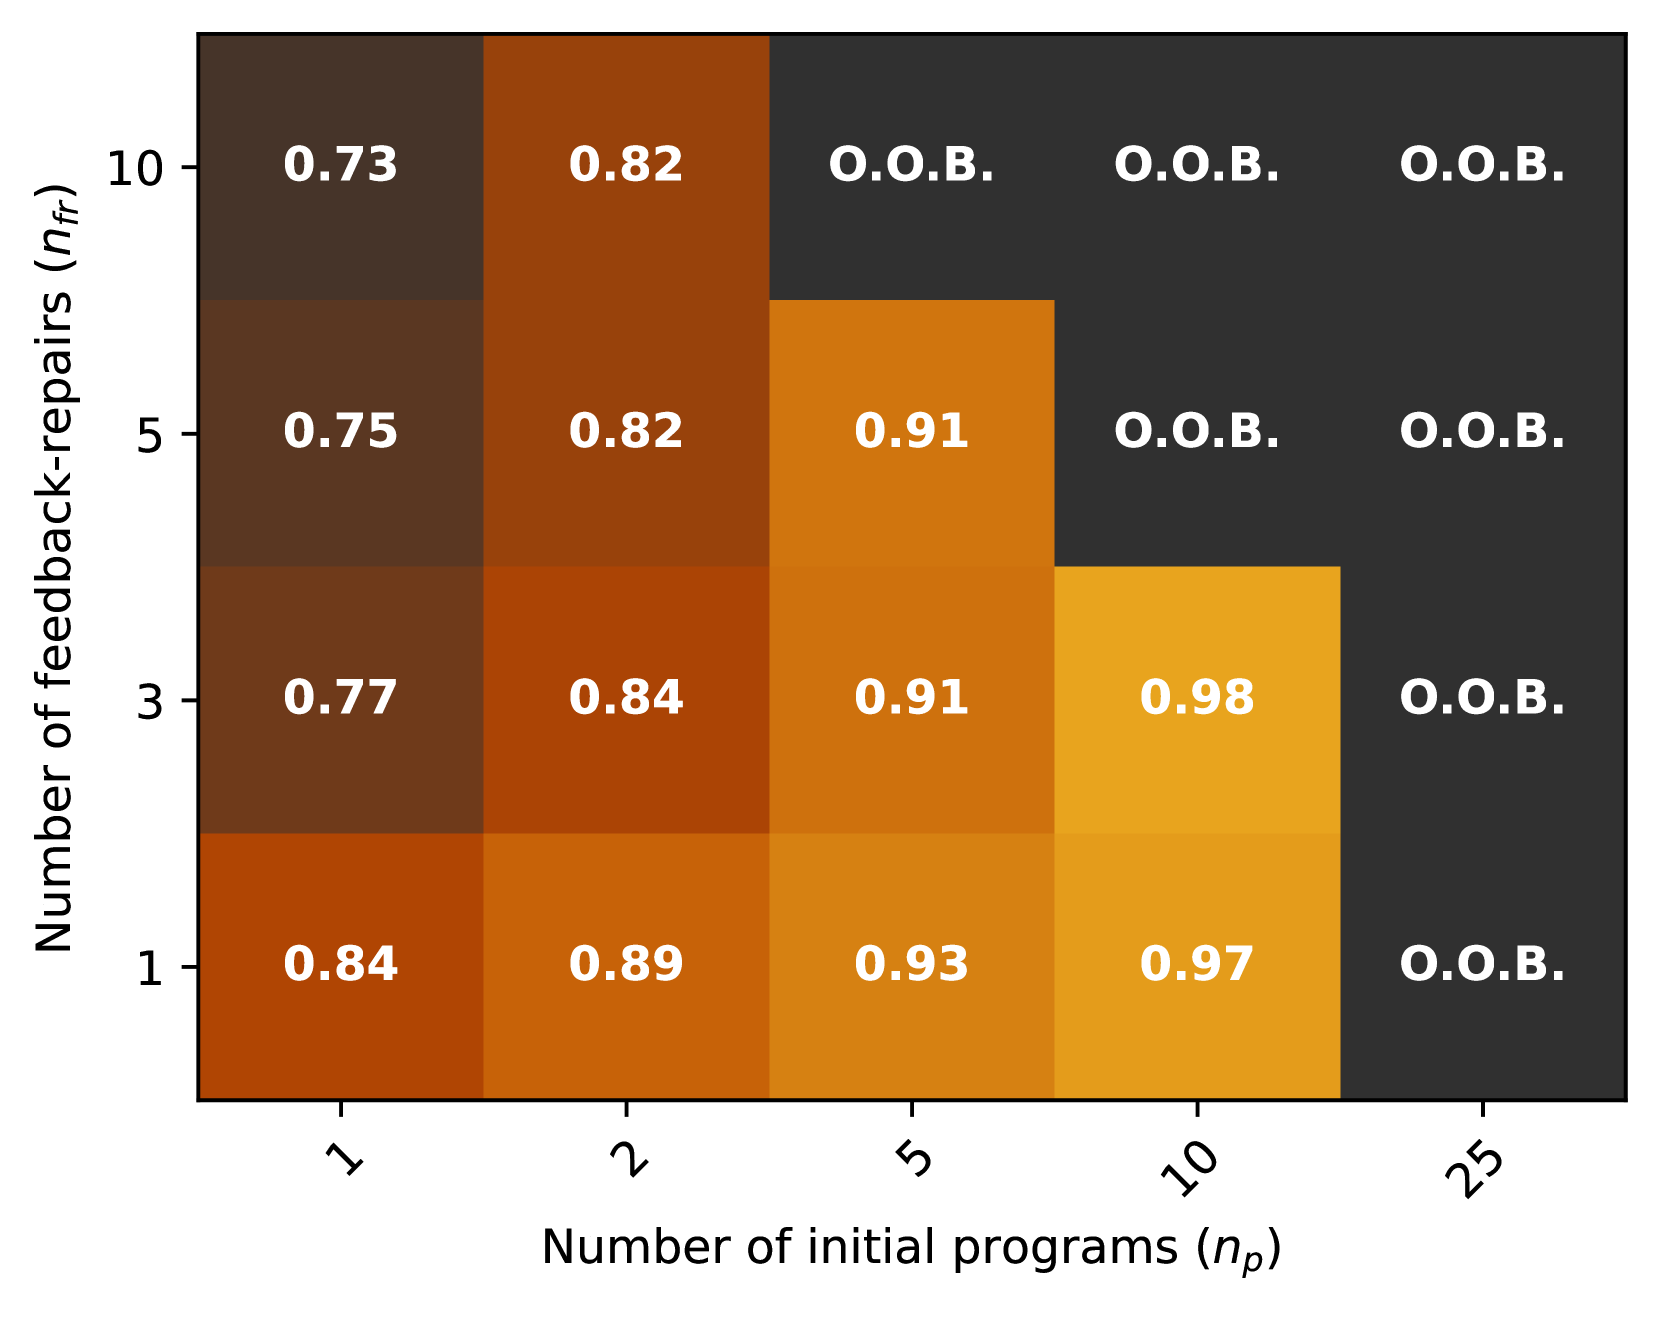
This image is a heatmap visualizing a performance metric (likely a success rate or score, ranging from 0 to 1) as a function of two parameters: the "Number of initial programs (n_p)" on the horizontal axis and the "Number of feedback-repairs (n_fr)" on the vertical axis. The color intensity represents the metric's value, with darker browns indicating lower scores and brighter oranges/yellows indicating higher scores. Cells marked "O.O.B." (likely "Out Of Bounds") are colored dark gray and represent conditions where the metric could not be computed or was invalid.
### Components/Axes
* **X-Axis (Horizontal):** Labeled "Number of initial programs (n_p)". The axis markers are at discrete values: 1, 2, 5, 10, and 25.
* **Y-Axis (Vertical):** Labeled "Number of feedback-repairs (n_fr)". The axis markers are at discrete values: 1, 3, 5, and 10.
* **Data Grid:** A 4x5 grid of cells, where each cell corresponds to a unique combination of (n_p, n_fr).
* **Color Scale:** A gradient from dark brown (lowest numerical values) through orange to bright yellow-orange (highest numerical values). A separate dark gray color is used for "O.O.B." cells.
* **Cell Labels:** Each cell contains either a numerical value (e.g., "0.73") or the text "O.O.B.".
### Detailed Analysis
The following table reconstructs the data from the heatmap. Values are read directly from the cell labels. The color description is based on visual inspection of the gradient.
| n_fr \ n_p | **1** | **2** | **5** | **10** | **25** |
| :--- | :--- | :--- | :--- | :--- | :--- |
| **10** | 0.73 (Dark Brown) | 0.82 (Medium Brown) | O.O.B. (Dark Gray) | O.O.B. (Dark Gray) | O.O.B. (Dark Gray) |
| **5** | 0.75 (Dark Brown) | 0.82 (Medium Brown) | 0.91 (Orange) | O.O.B. (Dark Gray) | O.O.B. (Dark Gray) |
| **3** | 0.77 (Dark Brown) | 0.84 (Medium Brown) | 0.91 (Orange) | 0.98 (Bright Yellow-Orange) | O.O.B. (Dark Gray) |
| **1** | 0.84 (Medium Brown) | 0.89 (Orange-Brown) | 0.93 (Orange) | 0.97 (Bright Yellow-Orange) | O.O.B. (Dark Gray) |
**Trend Verification:**
* **Horizontal Trend (Increasing n_p for fixed n_fr):** For a fixed number of feedback repairs (n_fr), the performance metric generally **increases** as the number of initial programs (n_p) increases, until it hits the "O.O.B." condition. For example, at n_fr=1, the value rises from 0.84 (n_p=1) to 0.97 (n_p=10).
* **Vertical Trend (Increasing n_fr for fixed n_p):** For a fixed number of initial programs (n_p), the relationship is less uniform. At low n_p (1 or 2), performance slightly **decreases** as n_fr increases (e.g., at n_p=1: 0.84 at n_fr=1 vs. 0.73 at n_fr=10). At n_p=5, performance is stable (0.91) for n_fr=3 and 5. The highest performance (0.98) occurs at a moderate combination (n_p=10, n_fr=3).
### Key Observations
1. **"O.O.B." Region:** The "Out Of Bounds" condition forms a clear region in the top-right of the heatmap. It occurs for all tested values when n_p=25, and for combinations where both n_p and n_fr are relatively high (e.g., n_p=10 with n_fr≥5, n_p=5 with n_fr=10).
2. **Peak Performance:** The highest observed value is **0.98**, located at the cell (n_p=10, n_fr=3).
3. **Performance Gradient:** The lowest numerical value is **0.73** at (n_p=1, n_fr=10). The general gradient shows performance improving from the bottom-left (low n_p, low n_fr) towards the center-right (moderate n_p, low-to-moderate n_fr).
4. **Color-Value Correlation:** The color scale is consistent. The darkest brown corresponds to the lowest value (0.73), and the brightest yellow-orange corresponds to the highest value (0.98). The "O.O.B." cells are uniformly dark gray, distinct from the performance gradient.
### Interpretation
This heatmap likely illustrates the results of an experiment in automated program repair or synthesis, where an initial set of programs (n_p) is refined through a number of feedback-repair cycles (n_fr). The metric is probably a success rate (e.g., percentage of problems solved).
* **Optimal Operating Range:** The data suggests an optimal "sweet spot" for resource allocation. Using a moderate number of initial programs (around 5-10) with a low-to-moderate number of feedback repairs (1-3) yields the highest success rates (0.91-0.98).
* **Diminishing Returns & Failure Modes:** Simply increasing resources does not guarantee better results. Beyond a certain point (the "O.O.B." boundary), the process likely fails entirely. This could be due to computational limits, search space explosion, or the repair mechanism becoming unstable with too many initial candidates or repair iterations.
* **Trade-off at Low Resources:** When starting with very few initial programs (n_p=1 or 2), applying more feedback repairs (higher n_fr) appears slightly detrimental. This might indicate that with a poor starting point, repeated repairs are ineffective or even degrade the solution.
* **Asymmetry of Parameters:** The number of initial programs (n_p) has a stronger positive influence on performance than the number of feedback repairs (n_fr), up to the failure boundary. The system benefits more from a diverse initial pool than from extensive iterative repair on a small pool.
In summary, the chart demonstrates that more resources (programs and repairs) can improve outcomes, but only within a specific operational envelope. Exceeding this envelope leads to complete process failure ("O.O.B."), highlighting the importance of parameter tuning in such systems.