## Heatmap: Relationship Between Feedback-Repairs and Initial Programs
### Overview
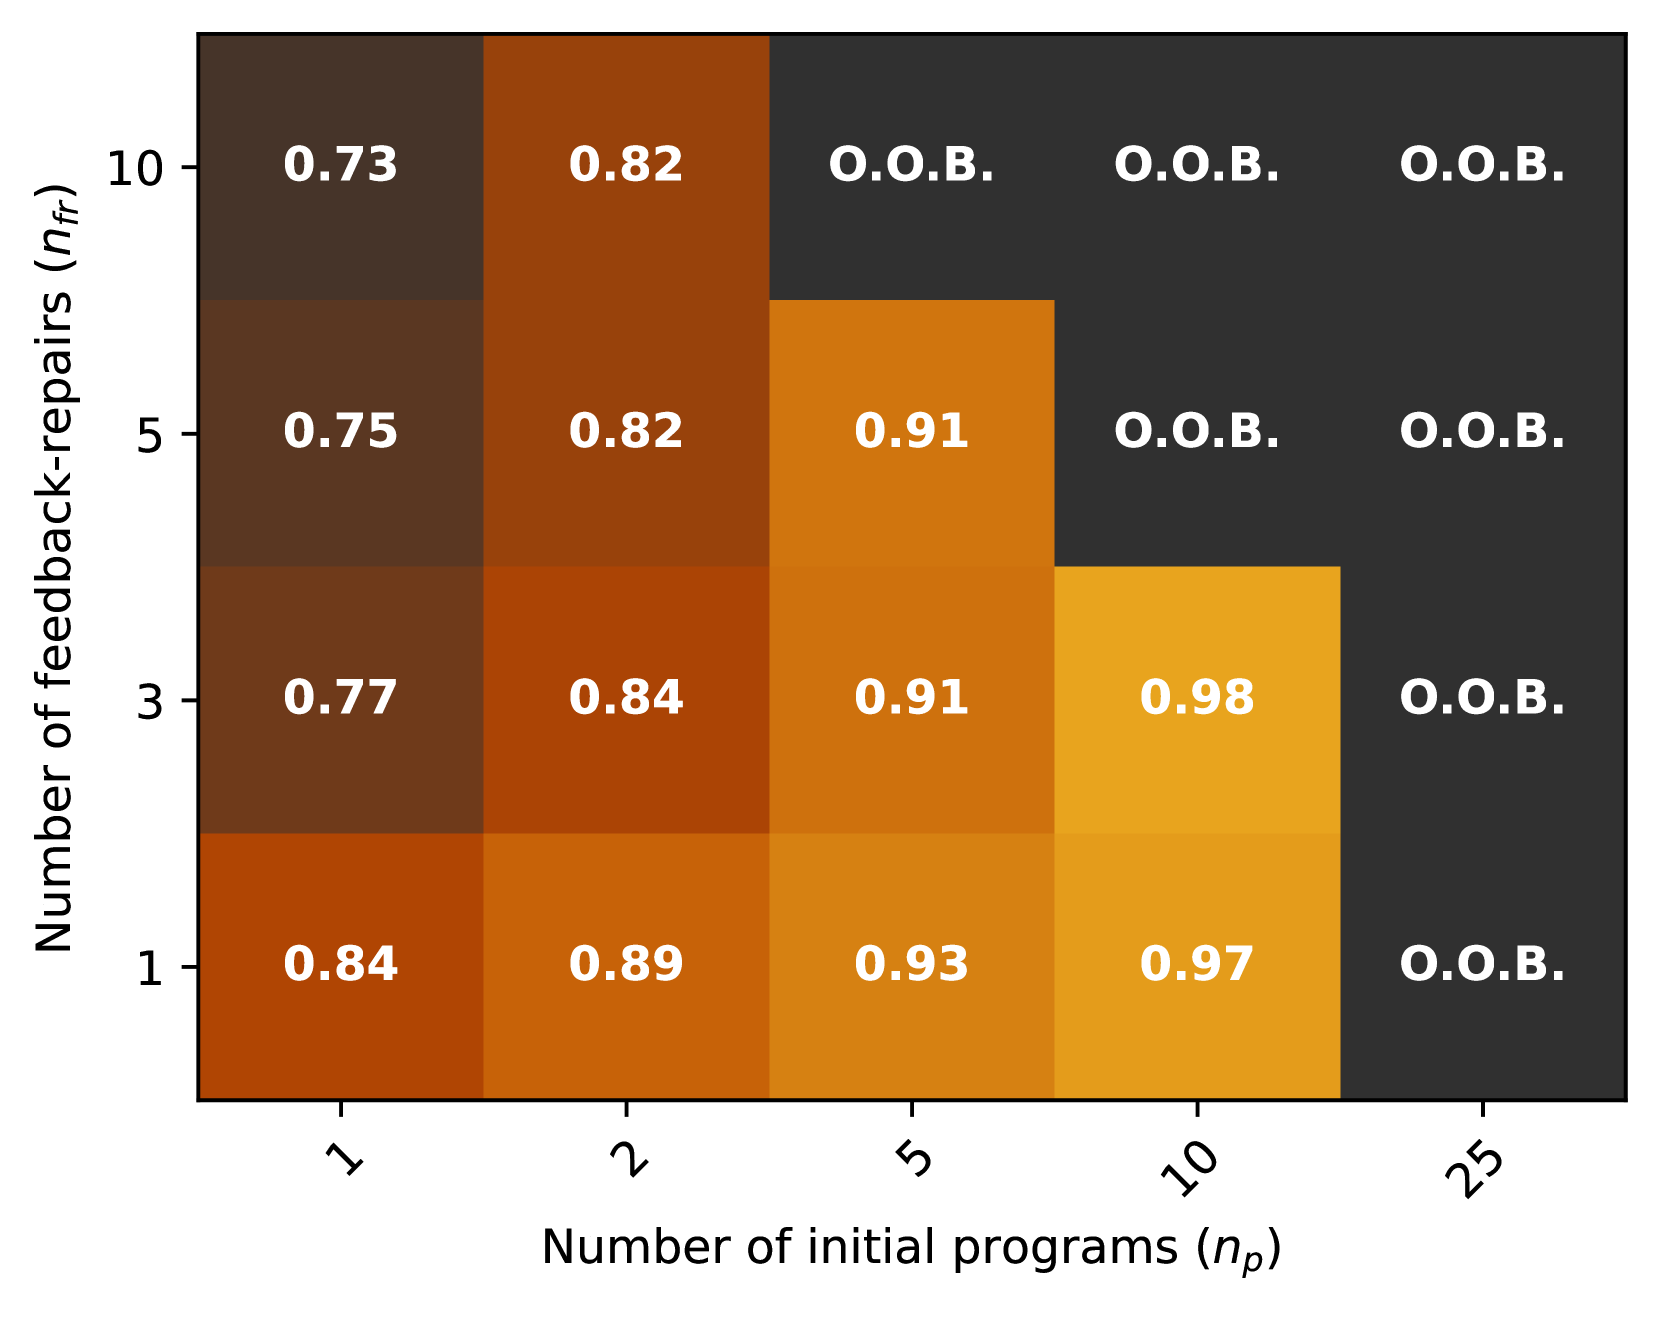
The image is a heatmap visualizing the relationship between the number of feedback-repairs (n_fr) and the number of initial programs (n_p). The heatmap uses color gradients (dark brown to yellow) to represent numerical values, with "O.O.B." (likely "Out of Bounds") indicating missing or undefined data in certain regions.
### Components/Axes
- **Y-axis (Vertical)**: "Number of feedback-repairs (n_fr)" with labels: 1, 3, 5, 10.
- **X-axis (Horizontal)**: "Number of initial programs (n_p)" with labels: 1, 2, 5, 10, 25.
- **Color Gradient**: Dark brown (low values) to yellow (high values), with black cells labeled "O.O.B." for undefined data.
- **Legend**: Not explicitly shown, but inferred from color intensity (darker = lower values, lighter = higher values).
### Detailed Analysis
- **Cell Values**:
- **n_p = 1**:
- n_fr = 1: 0.84
- n_fr = 3: 0.77
- n_fr = 5: 0.75
- n_fr = 10: 0.73
- **n_p = 2**:
- n_fr = 1: 0.89
- n_fr = 3: 0.84
- n_fr = 5: 0.82
- n_fr = 10: 0.82
- **n_p = 5**:
- n_fr = 1: 0.93
- n_fr = 3: 0.91
- n_fr = 5: 0.91
- n_fr = 10: 0.91
- **n_p = 10**:
- n_fr = 1: 0.97
- n_fr = 3: 0.98
- n_fr = 5: O.O.B.
- n_fr = 10: O.O.B.
- **n_p = 25**:
- All n_fr values: O.O.B.
### Key Observations
1. **Positive Correlation**: Higher n_p and n_fr generally correspond to higher values (e.g., 0.84 → 0.97 as n_p increases from 1 to 10).
2. **Threshold Effects**: Values plateau or become undefined (O.O.B.) for n_p ≥ 10 and n_fr ≥ 5.
3. **Anomalies**: The cell at (n_p=10, n_fr=3) has a high value (0.98), suggesting an outlier or special case.
4. **Missing Data**: The top-right quadrant (n_p ≥ 10, n_fr ≥ 5) is entirely "O.O.B.", indicating no valid data in this region.
### Interpretation
The heatmap suggests a **positive relationship** between the number of initial programs (n_p) and feedback-repairs (n_fr), with higher values of both variables leading to increased metrics (e.g., efficiency, success rates). However, the "O.O.B." entries imply that the system or model being analyzed **cannot handle combinations of n_p ≥ 10 and n_fr ≥ 5**, possibly due to:
- **Data collection limitations** (e.g., insufficient samples for high n_p/n_fr).
- **Model constraints** (e.g., the metric becomes undefined or unstable beyond certain thresholds).
- **Practical boundaries** (e.g., the system cannot process more than 10 initial programs or 5 feedback-repairs).
The outlier at (n_p=10, n_fr=3) with a value of 0.98 may indicate a unique scenario where high n_p and moderate n_fr yield exceptional results, warranting further investigation. The absence of data in the top-right quadrant highlights a critical gap in the dataset or analysis scope.