## Heatmaps: Before and After GRPO
### Overview
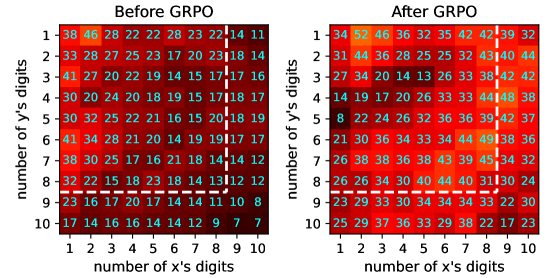
The image presents two heatmaps side-by-side, titled "Before GRPO" and "After GRPO". Each heatmap visualizes data related to the number of digits in 'x' and 'y', with the color intensity representing the magnitude of the data at each coordinate. A dashed white line is overlaid on each heatmap, forming an L-shape.
### Components/Axes
* **Titles:** "Before GRPO" (left), "After GRPO" (right)
* **X-axis:** "number of x's digits", with ticks labeled 1 to 10.
* **Y-axis:** "number of y's digits", with ticks labeled 1 to 10.
* **Data Representation:** Color intensity, with warmer colors (red, orange) indicating higher values and cooler colors (dark red, black) indicating lower values. The exact numerical value is printed in cyan on each cell.
* **L-shaped Overlay:** A dashed white line forming an L-shape on each heatmap. The L-shape starts at (9,1) and extends to (9,8) and (1,8).
### Detailed Analysis or ### Content Details
**Heatmap: Before GRPO**
| | 1 | 2 | 3 | 4 | 5 | 6 | 7 | 8 | 9 | 10 |
| :---- | :- | :- | :- | :- | :- | :- | :- | :- | :- | :- |
| **1** | 38 | 46 | 28 | 22 | 22 | 28 | 23 | 22 | 14 | 11 |
| **2** | 33 | 28 | 27 | 25 | 23 | 17 | 20 | 23 | 18 | 14 |
| **3** | 41 | 27 | 20 | 22 | 19 | 14 | 15 | 17 | 17 | 16 |
| **4** | 30 | 20 | 24 | 20 | 18 | 19 | 15 | 17 | 18 | 17 |
| **5** | 30 | 32 | 25 | 22 | 21 | 16 | 15 | 20 | 18 | 19 |
| **6** | 41 | 34 | 28 | 21 | 20 | 14 | 19 | 19 | 17 | 17 |
| **7** | 38 | 30 | 25 | 17 | 16 | 21 | 18 | 14 | 14 | 12 |
| **8** | 32 | 22 | 15 | 18 | 23 | 18 | 14 | 13 | 12 | 12 |
| **9** | 23 | 16 | 17 | 20 | 17 | 14 | 14 | 11 | 10 | 8 |
| **10**| 17 | 14 | 16 | 16 | 14 | 14 | 12 | 9 | 7 | 7 |
**Heatmap: After GRPO**
| | 1 | 2 | 3 | 4 | 5 | 6 | 7 | 8 | 9 | 10 |
| :---- | :- | :- | :- | :- | :- | :- | :- | :- | :- | :- |
| **1** | 34 | 52 | 46 | 36 | 32 | 35 | 42 | 42 | 39 | 32 |
| **2** | 31 | 44 | 36 | 28 | 25 | 25 | 32 | 43 | 40 | 44 |
| **3** | 27 | 34 | 20 | 14 | 13 | 26 | 33 | 38 | 42 | 42 |
| **4** | 14 | 19 | 17 | 20 | 26 | 33 | 33 | 44 | 48 | 38 |
| **5** | 8 | 22 | 24 | 26 | 32 | 36 | 36 | 39 | 42 | 37 |
| **6** | 21 | 30 | 36 | 34 | 33 | 34 | 44 | 49 | 38 | 36 |
| **7** | 26 | 38 | 38 | 36 | 38 | 43 | 39 | 45 | 34 | 32 |
| **8** | 26 | 26 | 34 | 30 | 40 | 44 | 40 | 31 | 30 | 24 |
| **9** | 23 | 29 | 33 | 30 | 34 | 34 | 34 | 33 | 22 | 30 |
| **10**| 25 | 29 | 37 | 36 | 33 | 29 | 38 | 22 | 17 | 23 |
### Key Observations
* **Highest Values:** Before GRPO, the highest value is 46 at (1,2). After GRPO, the highest value is 52 at (1,2).
* **L-Shaped Region:** The L-shaped region defined by the dashed white line appears to contain generally lower values in the "Before GRPO" heatmap compared to the "After GRPO" heatmap.
* **Value Changes:** Many individual cell values change significantly between the "Before" and "After" heatmaps.
### Interpretation
The heatmaps compare a certain metric before and after the application of "GRPO" (likely an optimization or processing technique). The x and y axes represent the number of digits in two input numbers, and the color intensity/numerical value represents some performance metric related to these inputs.
The L-shaped region likely represents a specific constraint or condition being applied. The change in values within this region after GRPO suggests that the technique has a targeted effect on this subset of inputs.
The overall shift in values and color intensities indicates that GRPO has a significant impact on the performance metric being visualized. The specific nature of this impact (improvement or degradation) would require further context about the metric itself. The increase in values in the L-shaped region after GRPO suggests that GRPO improves the metric for inputs within this constraint.