## Heatmap: Comparison of Metrics Before and After GRPO
### Overview
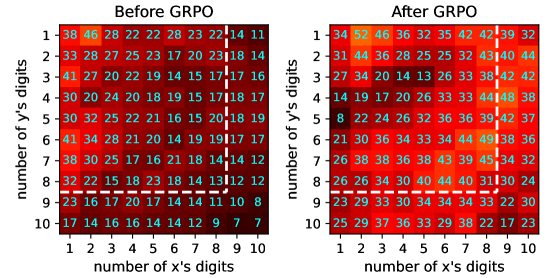
The image presents two side-by-side heatmaps comparing numerical values across a 10x10 grid. The left heatmap represents data "Before GRPO," while the right heatmap shows data "After GRPO." Both grids use a color gradient from red (high values) to blue (low values) to encode numerical data. The axes represent the "number of x's digits" (horizontal) and "number of y's digits" (vertical), both ranging from 1 to 10.
---
### Components/Axes
- **X-axis (horizontal)**: "number of x's digits" (1–10)
- **Y-axis (vertical)**: "number of y's digits" (1–10)
- **Color Legend**: Red (high values) to Blue (low values)
- **Key Text**:
- Top-left: "Before GRPO"
- Top-right: "After GRPO"
- Dashed white line separates the two heatmaps
---
### Detailed Analysis
#### Before GRPO
- **Row 1 (y=1)**: 38, 46, 28, 22, 22, 28, 23, 22, 14, 11
- **Row 2 (y=2)**: 33, 28, 27, 25, 23, 17, 20, 23, 18, 14
- **Row 3 (y=3)**: 41, 27, 20, 22, 19, 14, 15, 17, 17, 16
- **Row 4 (y=4)**: 30, 20, 24, 20, 18, 19, 15, 17, 18, 17
- **Row 5 (y=5)**: 30, 32, 25, 22, 21, 16, 15, 20, 18, 19
- **Row 6 (y=6)**: 41, 34, 28, 21, 20, 14, 19, 19, 17, 17
- **Row 7 (y=7)**: 38, 30, 25, 17, 16, 21, 18, 14, 14, 12
- **Row 8 (y=8)**: 32, 22, 15, 18, 23, 18, 14, 13, 12, 12
- **Row 9 (y=9)**: 23, 16, 17, 20, 17, 14, 14, 11, 10, 8
- **Row 10 (y=10)**: 17, 14, 16, 16, 14, 14, 12, 9, 7, 7
#### After GRPO
- **Row 1 (y=1)**: 34, 52, 46, 36, 32, 35, 42, 42, 39, 32
- **Row 2 (y=2)**: 31, 44, 36, 28, 25, 25, 32, 43, 40, 44
- **Row 3 (y=3)**: 27, 34, 20, 14, 13, 26, 33, 38, 42, 42
- **Row 4 (y=4)**: 14, 19, 17, 20, 26, 33, 33, 44, 48, 38
- **Row 5 (y=5)**: 8, 22, 24, 26, 32, 36, 36, 39, 42, 37
- **Row 6 (y=6)**: 21, 30, 36, 34, 33, 34, 44, 49, 38, 36
- **Row 7 (y=7)**: 26, 38, 38, 36, 38, 43, 39, 45, 34, 32
- **Row 8 (y=8)**: 26, 26, 34, 30, 40, 44, 40, 31, 30, 24
- **Row 9 (y=9)**: 23, 29, 33, 30, 34, 34, 34, 33, 22, 30
- **Row 10 (y=10)**: 25, 29, 37, 36, 33, 29, 38, 22, 17, 23
---
### Key Observations
1. **General Trend**:
- "After GRPO" values are **lower** (more blue) than "Before GRPO" in most cells, suggesting GRPO reduces the metric (e.g., error rates, costs).
- Exceptions: Some cells in "After GRPO" show **higher values** (e.g., y=1, x=2: 52; y=6, x=8: 49).
2. **Notable Outliers**:
- **Highest Value**: "After GRPO" at y=6, x=8 (49) exceeds all "Before GRPO" values.
- **Lowest Value**: "Before GRPO" at y=10, x=10 (7) is the smallest value in both heatmaps.
3. **Color Gradient**:
- "Before GRPO" has a **darker red dominance** (higher values), while "After GRPO" shifts toward **blue** (lower values).
---
### Interpretation
- **GRPO Impact**: The heatmaps suggest GRPO generally improves performance (lower values) across most digit combinations. However, the increase in certain cells (e.g., y=1, x=2) indicates potential trade-offs or edge cases where GRPO underperforms.
- **Digit Sensitivity**:
- Lower-digit combinations (e.g., x=1–3, y=1–3) show more significant reductions in "After GRPO," implying GRPO is more effective for simpler digit patterns.
- Higher-digit combinations (e.g., x=8–10, y=8–10) exhibit mixed results, with some cells worsening (e.g., y=8, x=8: 31 vs. 40 in "Before GRPO").
- **Anomalies**: The spike at y=6, x=8 (49) in "After GRPO" warrants investigation—could indicate a bug, overfitting, or a specific edge case not addressed by GRPO.
This analysis highlights GRPO's effectiveness in reducing the metric for most scenarios but underscores the need for further validation of edge cases.