\n
## Diagram: Plausible Explanations for Wet Grass
### Overview
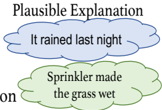
The image is a diagram illustrating two plausible explanations for why the grass is wet. It uses cloud-shaped bubbles to represent each explanation, connected by curved lines suggesting a causal relationship. The diagram is labeled with "Plausible Explanation" at the top and "Explanation" at the bottom-left.
### Components/Axes
The diagram consists of:
* **Title:** "Plausible Explanation" (top-center)
* **Explanation 1:** "It rained last night" (within a light blue cloud bubble)
* **Explanation 2:** "Sprinkler made the grass wet" (within a light green cloud bubble)
* **Label:** "Explanation" (bottom-left)
* **Connecting Lines:** Curved lines linking the title to the explanations.
### Detailed Analysis or Content Details
The diagram presents two distinct, independent explanations:
1. **Explanation 1:** The text within the light blue cloud states, "It rained last night."
2. **Explanation 2:** The text within the light green cloud states, "Sprinkler made the grass wet."
There are no numerical values or axes in this diagram. It is purely qualitative.
### Key Observations
The diagram highlights two possible causes for the same effect (wet grass). The use of cloud shapes suggests these are potential, rather than definitive, explanations. The diagram does not prioritize one explanation over the other.
### Interpretation
The diagram demonstrates a simple problem-solving approach: identifying multiple possible causes for an observed phenomenon. It illustrates that a single effect can have multiple explanations. The diagram is a visual aid for brainstorming or considering different hypotheses. It doesn't offer evidence to support either explanation, but simply presents them as possibilities. The diagram is a basic example of abductive reasoning – inferring the best explanation given the available evidence.