## Line Chart: Output Frequency vs. Vdc for Different Vlk Values
### Overview
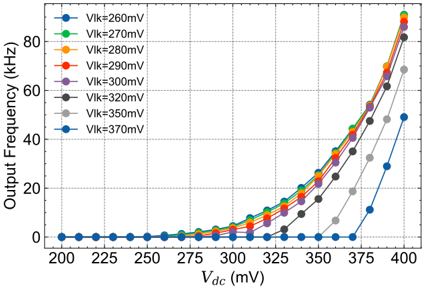
The image is a line chart showing the relationship between output frequency (in kHz) and Vdc (in mV) for various values of Vlk (also in mV). The chart displays multiple lines, each representing a different Vlk value, allowing for a comparison of how Vdc affects output frequency at different Vlk settings.
### Components/Axes
* **X-axis:** Vdc (mV), ranging from 200 to 400 in increments of 25.
* **Y-axis:** Output Frequency (kHz), ranging from 0 to 80 in increments of 20.
* **Legend:** Located in the top-left corner, the legend identifies each line by its corresponding Vlk value:
* Blue: Vlk = 260mV
* Green: Vlk = 270mV
* Orange: Vlk = 280mV
* Red: Vlk = 290mV
* Purple: Vlk = 300mV
* Black: Vlk = 320mV
* Gray: Vlk = 350mV
* Dark Blue: Vlk = 370mV
### Detailed Analysis
Here's a breakdown of each data series, including trend descriptions and approximate data points:
* **Vlk = 260mV (Blue):** The output frequency remains at 0 kHz until Vdc reaches approximately 375 mV. Then, the output frequency increases sharply to approximately 50 kHz at Vdc = 400 mV.
* **Vlk = 270mV (Green):** The output frequency remains at 0 kHz until Vdc reaches approximately 325 mV. Then, the output frequency increases to approximately 75 kHz at Vdc = 400 mV.
* **Vlk = 280mV (Orange):** The output frequency remains at 0 kHz until Vdc reaches approximately 325 mV. Then, the output frequency increases to approximately 80 kHz at Vdc = 400 mV.
* **Vlk = 290mV (Red):** The output frequency remains at 0 kHz until Vdc reaches approximately 325 mV. Then, the output frequency increases to approximately 82 kHz at Vdc = 400 mV.
* **Vlk = 300mV (Purple):** The output frequency remains at 0 kHz until Vdc reaches approximately 325 mV. Then, the output frequency increases to approximately 70 kHz at Vdc = 400 mV.
* **Vlk = 320mV (Black):** The output frequency remains at 0 kHz until Vdc reaches approximately 350 mV. Then, the output frequency increases to approximately 50 kHz at Vdc = 400 mV.
* **Vlk = 350mV (Gray):** The output frequency remains at 0 kHz until Vdc reaches approximately 375 mV. Then, the output frequency increases to approximately 45 kHz at Vdc = 400 mV.
* **Vlk = 370mV (Dark Blue):** The output frequency remains at 0 kHz until Vdc reaches approximately 375 mV. Then, the output frequency increases to approximately 20 kHz at Vdc = 400 mV.
### Key Observations
* For all Vlk values, the output frequency remains at or near 0 kHz until Vdc reaches a certain threshold.
* The threshold Vdc value at which the output frequency starts to increase varies depending on the Vlk value. Higher Vlk values generally result in lower threshold Vdc values.
* The rate of increase in output frequency with respect to Vdc is generally very steep once the threshold is reached.
* The output frequency at Vdc = 400 mV varies significantly depending on the Vlk value.
### Interpretation
The chart demonstrates the relationship between Vdc, Vlk, and output frequency. It suggests that Vlk acts as a control parameter, influencing the threshold Vdc value required to initiate a significant output frequency. The data indicates that increasing Vlk generally lowers the Vdc threshold for output frequency activation. This relationship could be crucial in designing and optimizing circuits where precise control over output frequency is required based on specific voltage parameters. The steep increase in output frequency after the threshold suggests a non-linear relationship, possibly indicative of a switching behavior or a rapid amplification effect within the circuit.