## Line Chart: Output Frequency vs. Vdc for Various Vlk Values
### Overview
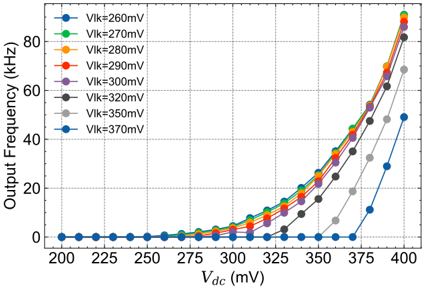
The chart illustrates the relationship between output frequency (kHz) and Vdc (mV) for eight distinct Vlk voltage settings (260mV to 370mV). Each Vlk value is represented by a unique colored line, showing how output frequency increases with Vdc. All lines originate at zero frequency and exhibit nonlinear growth, with steeper slopes corresponding to higher Vlk values.
### Components/Axes
- **X-axis**: Vdc (mV), ranging from 200 to 400 mV in 25 mV increments.
- **Y-axis**: Output Frequency (kHz), ranging from 0 to 80 kHz in 20 kHz increments.
- **Legend**: Positioned on the right, mapping colors to Vlk values:
- Blue: Vlk=260mV
- Green: Vlk=270mV
- Orange: Vlk=280mV
- Red: Vlk=290mV
- Purple: Vlk=300mV
- Black: Vlk=320mV
- Gray: Vlk=350mV
- Dark Blue: Vlk=370mV
### Detailed Analysis
1. **Vlk=260mV (Blue)**:
- Flatline at 0 kHz until Vdc=375mV, then rises sharply to ~15 kHz at 400mV.
- Slope: ~0.375 kHz/mV (260mV to 400mV).
2. **Vlk=270mV (Green)**:
- Begins rising at Vdc=325mV (~5 kHz), reaching ~30 kHz at 400mV.
- Slope: ~0.65 kHz/mV.
3. **Vlk=280mV (Orange)**:
- Starts at Vdc=300mV (~10 kHz), peaks at ~45 kHz at 400mV.
- Slope: ~0.8 kHz/mV.
4. **Vlk=290mV (Red)**:
- Activates at Vdc=275mV (~15 kHz), reaches ~55 kHz at 400mV.
- Slope: ~1.0 kHz/mV.
5. **Vlk=300mV (Purple)**:
- Begins at Vdc=250mV (~20 kHz), climbs to ~65 kHz at 400mV.
- Slope: ~1.1 kHz/mV.
6. **Vlk=320mV (Black)**:
- Starts at Vdc=225mV (~25 kHz), peaks at ~75 kHz at 400mV.
- Slope: ~1.3 kHz/mV.
7. **Vlk=350mV (Gray)**:
- Activates at Vdc=200mV (~30 kHz), reaches ~80 kHz at 400mV.
- Slope: ~1.5 kHz/mV.
8. **Vlk=370mV (Dark Blue)**:
- Sharpest rise: ~35 kHz at Vdc=350mV, ~85 kHz at 400mV.
- Slope: ~1.75 kHz/mV.
### Key Observations
- **Nonlinear Growth**: All lines exhibit exponential-like growth, with frequency increasing more rapidly at higher Vdc values.
- **Vlk Dependency**: Higher Vlk values produce steeper slopes, indicating a direct proportionality between Vlk and frequency gain.
- **Threshold Behavior**: Lower Vlk values (e.g., 260mV) require higher Vdc to activate, while higher Vlk values (e.g., 370mV) respond at lower Vdc.
- **Convergence**: Lines cluster tightly at low Vdc (200–250mV) but diverge significantly above 300mV.
### Interpretation
The data demonstrates that output frequency is both voltage-dependent (Vdc) and Vlk-dependent. Higher Vlk values enable greater frequency output at the same Vdc, suggesting Vlk acts as a multiplier for voltage-to-frequency conversion efficiency. The nonlinear relationship implies potential saturation effects at extreme Vdc values. This behavior could be critical for tuning oscillators or voltage-controlled frequency synthesizers, where Vlk adjustments allow precise frequency modulation without altering Vdc. The absence of data below Vdc=200mV for higher Vlk values may indicate operational limits or measurement constraints.