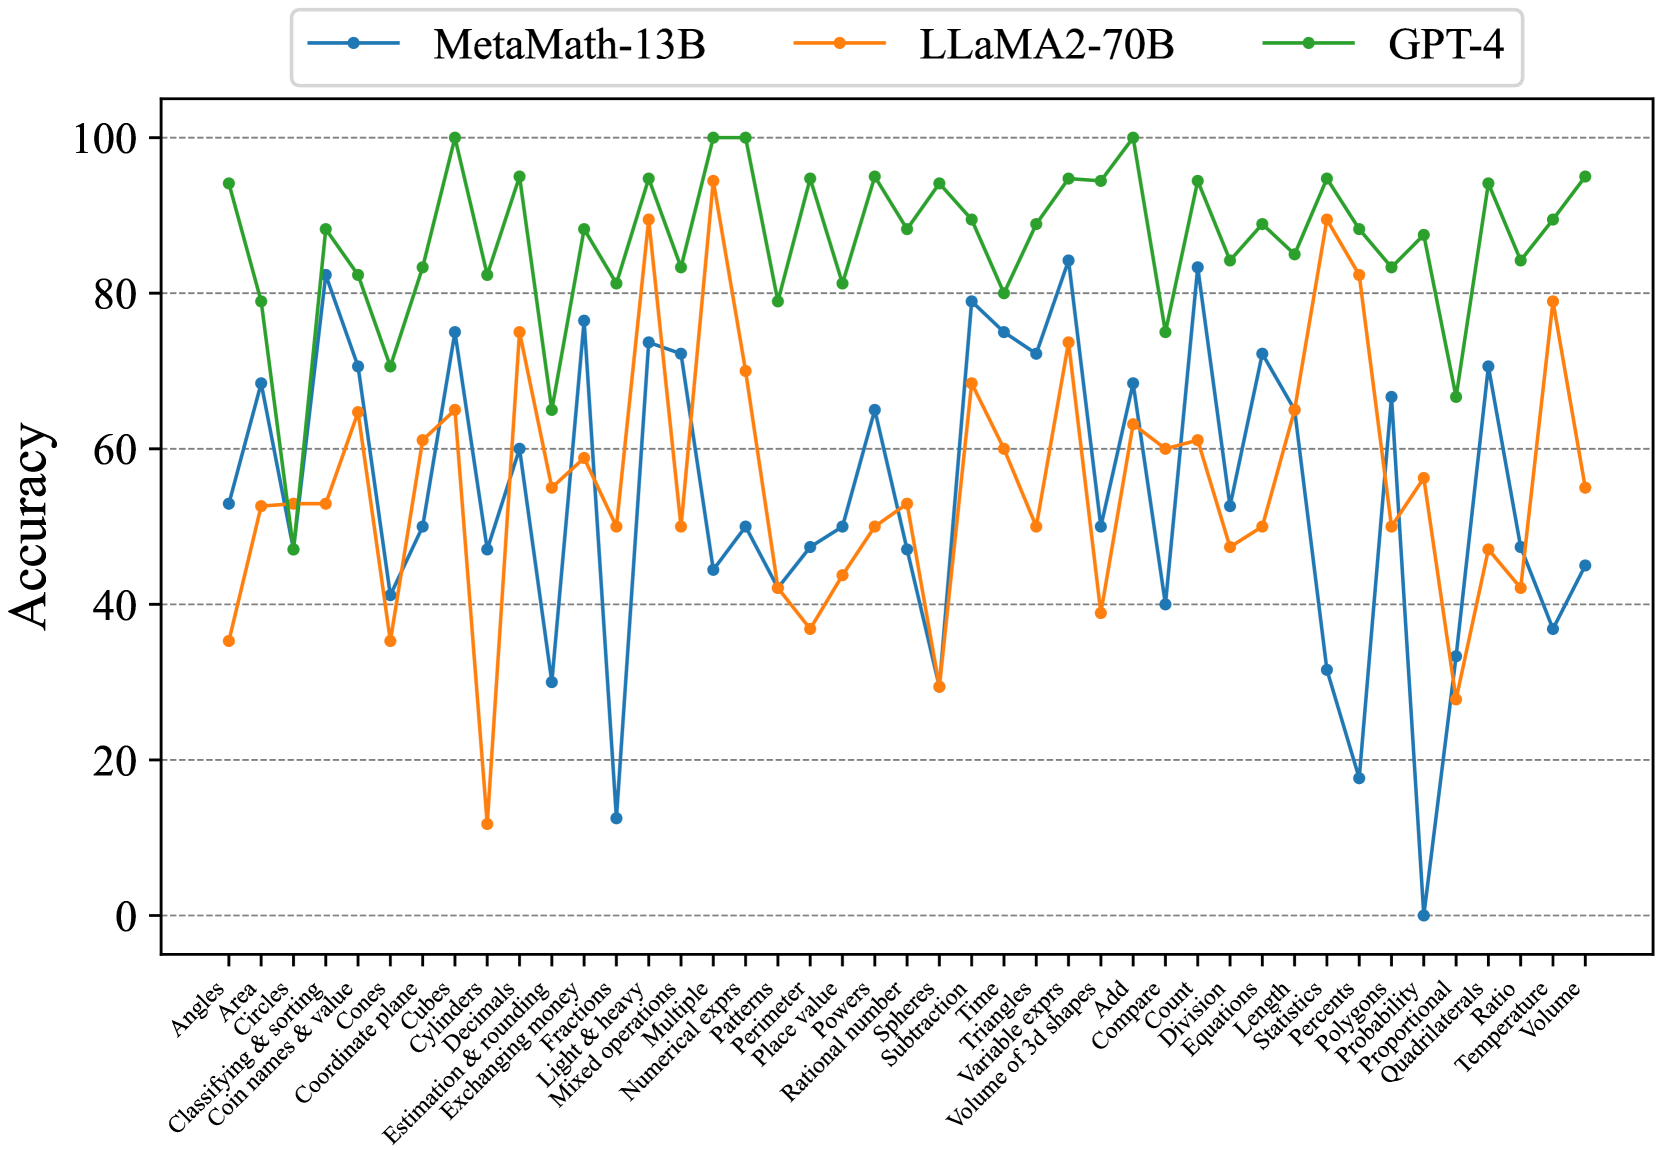
## Line Chart: Accuracy of Three AI Models Across Mathematical Topics
### Overview
This image is a line chart comparing the performance accuracy (in percentage) of three large language models—MetaMath-13B, LLaMA2-70B, and GPT-4—across a wide range of mathematical problem categories. The chart visualizes how each model's accuracy fluctuates depending on the specific topic.
### Components/Axes
* **Chart Type:** Multi-line chart with markers.
* **Y-Axis:** Labeled "Accuracy". Scale runs from 0 to 100 in increments of 20, with gridlines at each increment.
* **X-Axis:** Lists 42 distinct mathematical topics or problem types. The labels are rotated approximately 45 degrees for readability.
* **Legend:** Positioned at the top-center of the chart. It defines the three data series:
* **MetaMath-13B:** Blue line with circular markers.
* **LLaMA2-70B:** Orange line with circular markers.
* **GPT-4:** Green line with circular markers.
### Detailed Analysis
**Data Series Trends & Approximate Values:**
**1. GPT-4 (Green Line):**
* **Trend:** Consistently the highest-performing model across nearly all topics. Its line remains in the upper portion of the chart, rarely dipping below 80% accuracy. It shows a relatively stable, high-performance trend with moderate fluctuations.
* **Key Approximate Data Points (Selected):**
* Highs (~95-100%): Angles, Cubes, Fractions, Mixed operations, Numerical exprs, Rational number, Triangles, Volume of 3d shapes, Probability, Quadrilaterals, Volume.
* Lows (~70-80%): Cones, Coordinate plane, Decimals, Patterns, Subtraction, Compare, Division, Length, Percent, Polygons, Proportional, Ratio.
**2. MetaMath-13B (Blue Line):**
* **Trend:** Exhibits high variability. It performs well on some topics (e.g., Classifying & sorting, Cubes, Triangles) but shows dramatic drops to very low accuracy on others (e.g., Exchanging money, Probability). Its line has the most pronounced peaks and valleys.
* **Key Approximate Data Points (Selected):**
* Highs (~75-85%): Classifying & sorting, Cubes, Fractions, Triangles, Volume of 3d shapes, Count, Equations, Statistics.
* Lows (~0-30%): Exchanging money, Light & heavy, Patterns, Probability, Proportional.
**3. LLaMA2-70B (Orange Line):**
* **Trend:** Generally performs in the middle range between the other two models. It shows significant volatility, with sharp drops on specific topics (e.g., Cylinders, Light & heavy, Subtraction) and strong peaks on others (e.g., Mixed operations, Percents).
* **Key Approximate Data Points (Selected):**
* Highs (~75-95%): Mixed operations, Percents, Volume.
* Lows (~10-40%): Cylinders, Light & heavy, Subtraction, Probability, Quadrilaterals.
**X-Axis Topics (Complete List):**
Angles, Area, Circles, Classifying & sorting, Coin names & value, Cones, Coordinate plane, Cubes, Cylinders, Decimals, Estimation & rounding, Exchanging money, Fractions, Light & heavy, Mixed operations, Multiple, Numerical exprs, Patterns, Perimeter, Place value, Powers, Rational number, Spheres, Subtraction, Time, Triangles, Variable exprs, Volume of 3d shapes, Add, Compare, Count, Division, Equations, Length, Statistics, Percents, Polygons, Probability, Proportional, Quadrilaterals, Ratio, Temperature, Volume.
### Key Observations
1. **Performance Hierarchy:** A clear hierarchy is visible: GPT-4 > LLaMA2-70B ≈ MetaMath-13B, with the latter two often crossing but generally following this order.
2. **Topic Sensitivity:** All models show significant performance variation based on the mathematical topic. No model is uniformly excellent or poor.
3. **Notable Outliers:**
* **MetaMath-13B** plummets to near 0% on "Probability" and very low on "Proportional" and "Exchanging money".
* **LLaMA2-70B** has a severe dip on "Cylinders" (~12%) and "Light & heavy" (~12%).
* **GPT-4** has its lowest point on "Cones" (~70%), which is still higher than the average performance of the other models on many topics.
4. **Correlated Dips:** There are topics where all three models struggle simultaneously, indicated by a synchronized dip in all three lines. Examples include "Patterns", "Subtraction", and "Probability". This suggests these topics are inherently more challenging for the evaluated models.
### Interpretation
This chart provides a comparative benchmark of mathematical reasoning capabilities across different AI model architectures and sizes. The data suggests that:
* **Model Scale and Training Matter:** GPT-4's consistently superior performance likely reflects its larger scale and/or more advanced training methodology for mathematical reasoning.
* **Specialization vs. Generalization:** MetaMath-13B, despite its name suggesting mathematical specialization, shows extreme weakness in specific areas like probability and proportional reasoning, indicating potential gaps in its training data or fine-tuning. LLaMA2-70B shows a more generalized but still inconsistent performance.
* **The Challenge of "Simple" Math:** The synchronized poor performance on topics like "Subtraction" and "Patterns" is intriguing. It may indicate that these foundational concepts, when framed as specific problem types, present unique challenges that are not solved simply by scaling up models. They might require different training approaches or data.
* **Practical Implications:** For a user or developer, this chart is a guide for model selection. If the task involves "Probability" or "Proportional" reasoning, GPT-4 is the only reliable choice among these three. For topics like "Volume" or "Mixed operations," the performance gap narrows, and other factors like cost or speed might influence the choice.
The chart effectively communicates that AI mathematical proficiency is not monolithic but is a landscape of strengths and weaknesses that vary dramatically by topic.