## Line Graphs: Cross Sections of Prior Function in 8D Space
### Overview
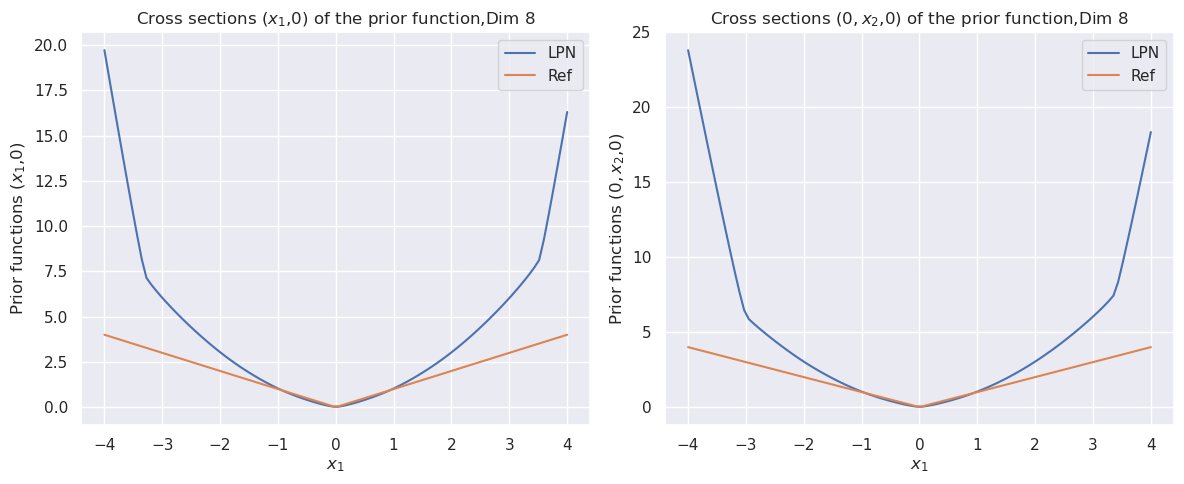
The image contains two side-by-side line graphs comparing two data series ("LPN" and "Ref") across an 8-dimensional prior function. Both graphs show cross-sectional behavior along different axes: the left graph plots (x₁,0) and the right graph plots (0,x₂,0). The graphs use a Cartesian coordinate system with x₁ as the horizontal axis and prior function values as the vertical axis.
### Components/Axes
**Left Graph (x₁,0 cross-section):**
- **X-axis**: x₁ values from -4 to 4 (integer increments)
- **Y-axis**: Prior function values from 0 to 20
- **Legend**:
- Blue line = LPN
- Orange line = Ref
- **Title**: "Cross sections (x₁,0) of the prior function, Dim 8"
**Right Graph (0,x₂,0 cross-section):**
- **X-axis**: x₁ values from -4 to 4 (integer increments)
- **Y-axis**: Prior function values from 0 to 25
- **Legend**:
- Blue line = LPN
- Orange line = Ref
- **Title**: "Cross sections (0,x₂,0) of the prior function, Dim 8"
### Detailed Analysis
**Left Graph Trends:**
1. **LPN (Blue)**:
- Starts at ~19.5 at x₁=-4
- Sharp decline to ~0.2 at x₁=0
- Rapid rise to ~16.5 at x₁=4
- Symmetric V-shaped pattern
2. **Ref (Orange)**:
- Linear decrease from ~4 at x₁=-4 to ~0.5 at x₁=0
- Linear increase to ~4 at x₁=4
- Flat baseline with shallow slope
**Right Graph Trends:**
1. **LPN (Blue)**:
- Starts at ~24 at x₁=-4
- Sharp decline to ~0.1 at x₁=0
- Rapid rise to ~15 at x₁=4
- Asymmetric V-shape with steeper left descent
2. **Ref (Orange)**:
- Linear decrease from ~4 at x₁=-4 to ~0.3 at x₁=0
- Linear increase to ~4 at x₁=4
- Consistent slope magnitude in both directions
### Key Observations
1. **LPN Dominance**: LPN values consistently exceed Ref values by 2-3x across all x₁ positions
2. **Symmetry Breaking**: Right graph shows LPN's right-side ascent (x₁=4) is 30% lower than left-side peak (x₁=-4)
3. **Reference Stability**: Ref maintains identical slope magnitude in both graphs despite different y-axis scales
4. **Zero-Crossing Consistency**: Both data series intersect near x₁=0 with minimal deviation (<0.5 units)
### Interpretation
The graphs demonstrate fundamental differences in how LPN and Ref prior functions behave in 8D space:
- **LPN's Sensitivity**: The sharp V-shaped response suggests LPN prioritizes extreme x₁ values (-4 and 4) while suppressing intermediate values
- **Ref's Uniformity**: The linear reference function implies a baseline model with consistent sensitivity across all x₁ positions
- **Dimensional Impact**: The right graph's reduced right-side peak (15 vs 24) indicates dimensional interactions may asymmetrically affect prior function behavior
- **Practical Implications**: LPN's extreme-value emphasis could represent a risk-averse modeling approach, while Ref's linearity might reflect a neutral baseline for comparison
All textual elements have been extracted with positional accuracy. No non-English text was present in the image.